Managing Alerts
Alert Console in ITOps is the area within the application which displays alerts and provides functionalities to take action on the alerts.
Contents
Viewing Alert List
To view alerts corresponding to a project, perform the following steps:
-
Login to SmartOps ITOPs as an ITOPs Engineer user. This displays the ITOPs dashboard as shown in FigureFigure
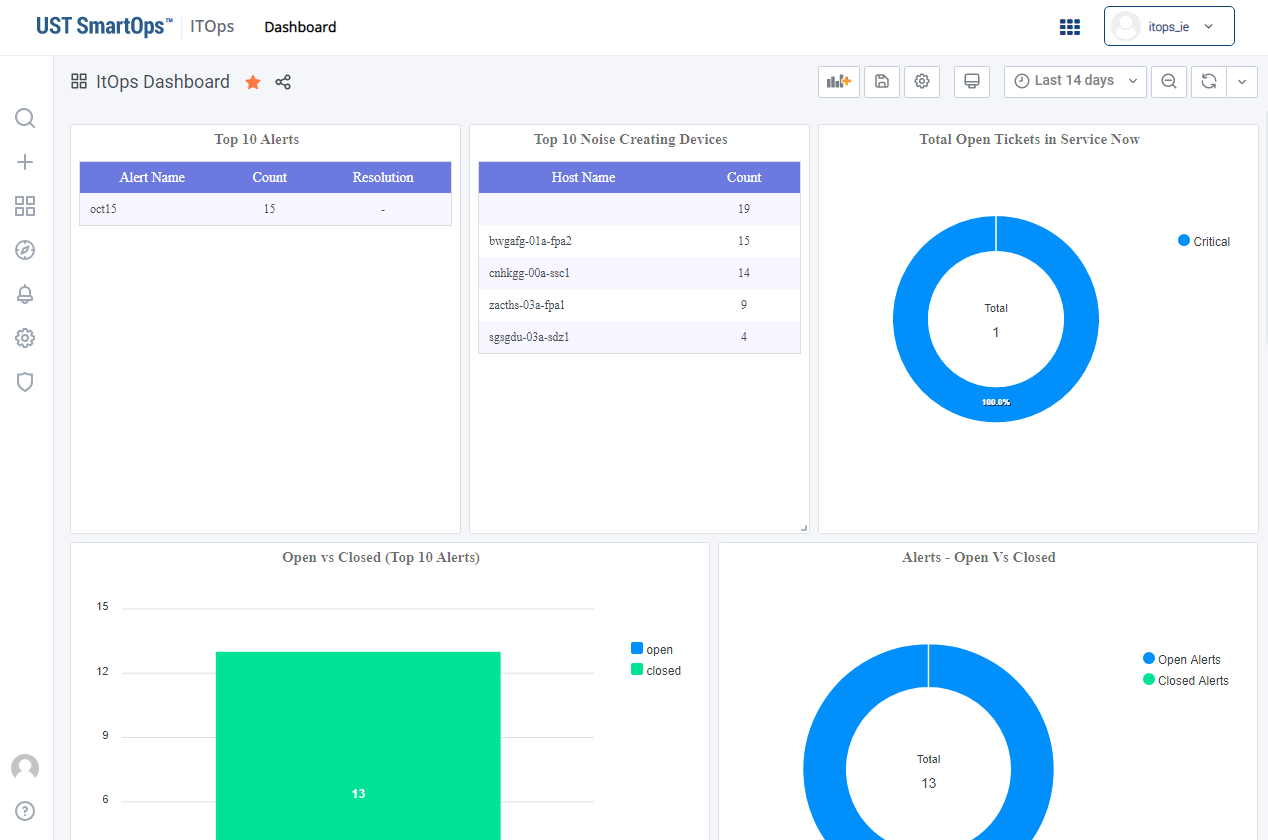
Note: The dashboard corresponding to the saved/favourite project is displayed, by default. -
Click Alert tab. This displays the Alerts screen as shown in FigureFigure.
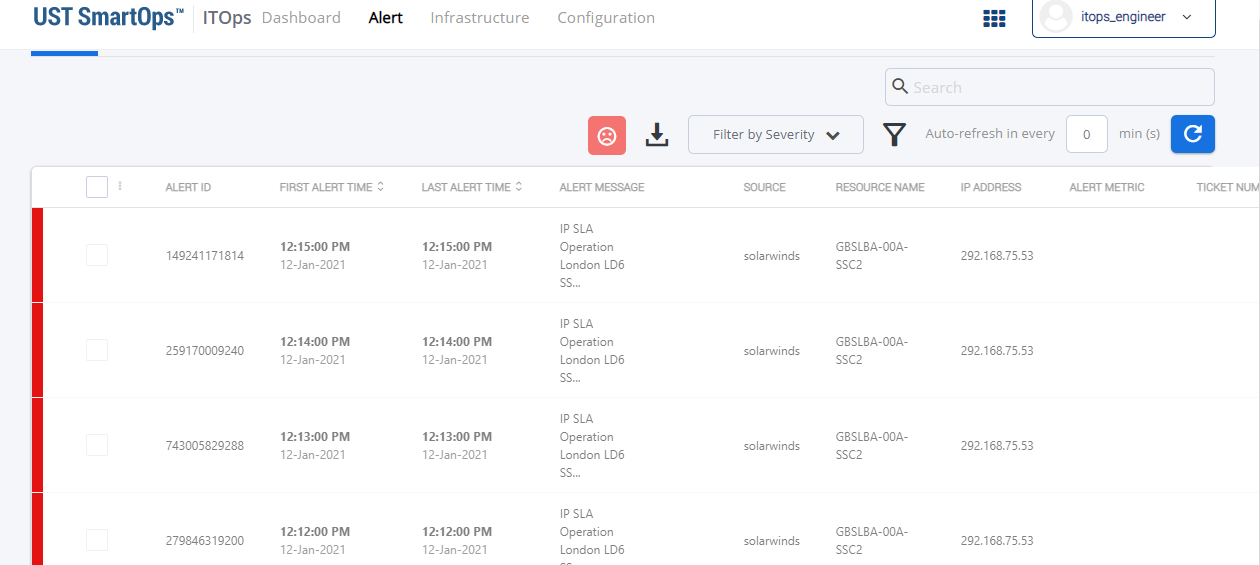
This lists the alerts and corresponding details. -
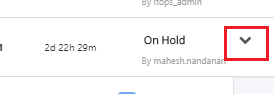
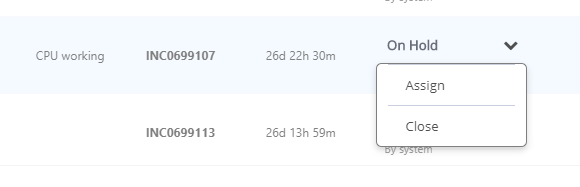
To assign an alert to respective users click on the expand icon corresponding to the alert as shown in FigureFigure.
-
Click on Assign to assign the alert to respective engineer users.
-
Click on Close to close the alert.
-
Click on Acknowledge to acknowledge the alert.
-
-
To download an alert, click on
 icon.
icon. -
You may search for the required alert from the Search field.
-
You may filter the required alert based on severity from the Filter By Severity field.
-
You may specify the interval for auto refresh in the Auto refresh in every (mins) field.
Viewing Severity of the Alerts
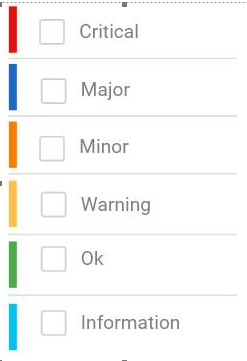
ITOPs PWF enables to visually identify the severity of alerts in Alert Listing so that user can quickly identify the alerts that needs urgent attention. Severity of alerts is identified as follows:
-
Critical – Red
-
Major – Blue
-
Minor– Orange
-
Warning - Yellow
-
Ok – Green
-
Information - Sky Blue
When a new alert is received and correlated with an existing alert cluster, the severity indication strip displays the color of latest alert's severity.
Sort by Severity
Alerts available in the Alert listing page can be filtered based on severity of the alert.

To filter based on severity, select the required severity from the drop-down menu. The list will be refreshed based on the severity selected.
Refresh/Auto Refresh feature
An ITOPs Administrator or ITOPs engineer is enabled with the feature to specify the refresh interval of alert listing page so that the list page displays latest information.
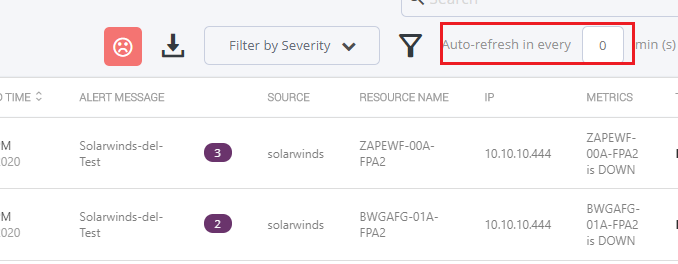
To define auto refresh interval, enter the duration (mins) and click on the ![]() icon.
icon.
Facility to download alerts
An ITOPs Administrator or ITOPs engineer is enabled with the capability to download alerts as .CSV file.
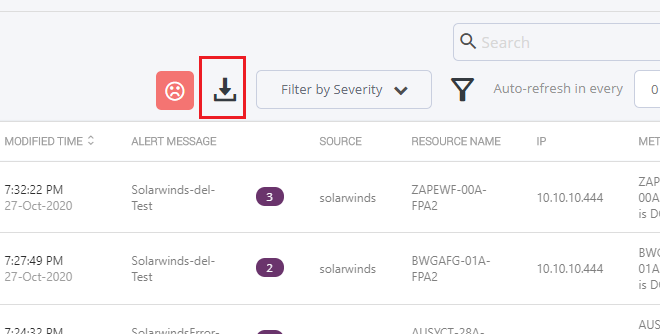
To download alerts, click on the Download icon to download the file.
Advanced Filter
An ITOPs Administrator or ITOPs engineer can filter an search for alerts using Advanced Filter feature.
An ITOps user is enabled with the capability to save a filter as default so that the user need not re-apply the filter condition at each login. ITOps user will also have the provision to save a filter as "Favourite".
Only created user or ITOps admin will be able to edit or delete a saved filter.
To filter alerts, click on ![]() . This displays the Advanced Filter window as shown in FigureFigure:
. This displays the Advanced Filter window as shown in FigureFigure:
Select the required filter(s), as per requirement. The fields and description is available in the table below:
|
Fields |
Description |
|
Source and Resources |
|
|
Source |
Select the name of the source. |
|
Resource Name |
Enter the name of the resource. |
|
State and Status |
|
|
Alert Severity |
Select the severity of the alert. Severity available are:
|
|
Alert State |
Select the alert state. Alert states available are:
|
|
Incident Status |
Select the required incident status. Status available are:
|
|
Cluster Type |
Select the required cluster type. Cluster Types available are:
|
|
Assignment |
|
|
Assigned To |
Select the required assignee from the list. |
|
Assigned Group |
Select the required assignment group. |
|
Date and Time |
|
|
From |
Select the date from which filter is to be performed. |
|
To |
Select the date to which filter is to be performed. or Select the period in last duration. |
Save the filter, if you require to save the filter comditions. Once saved, the saved filters will be available on the left pane.
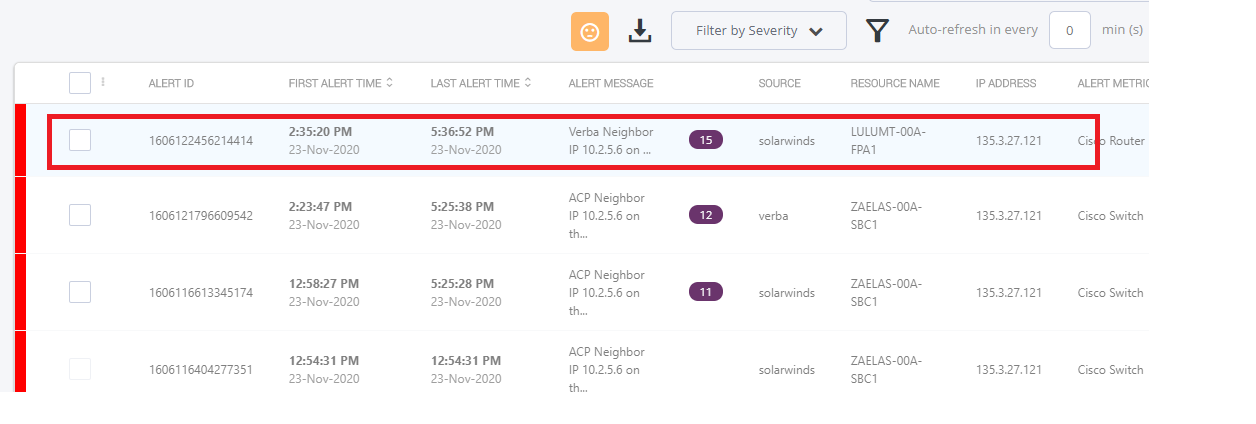
Viewing Correlated Alerts
ITOPs PWF enables to correlate related alerts to an existing alert and display as a single line item.
To view the correlated alerts, perform the following steps:
-
Login to SmartOps ITOPs as an ITOPs Admin user. This displays the ITOPs dashboard as shown in FigureFigure.
Note: The dashboard corresponding to the saved/favourite project is displayed, by default. -
Click Alert tab. This displays the Alerts screen as shown in FigureFigure.
This lists the alerts and corresponding details. -
Correlated Alerts with be displayed as a single line item as shown in FigureFigure.
-
Click on the number of alerts to view the list of correlated alerts as shown in FigureFigure.
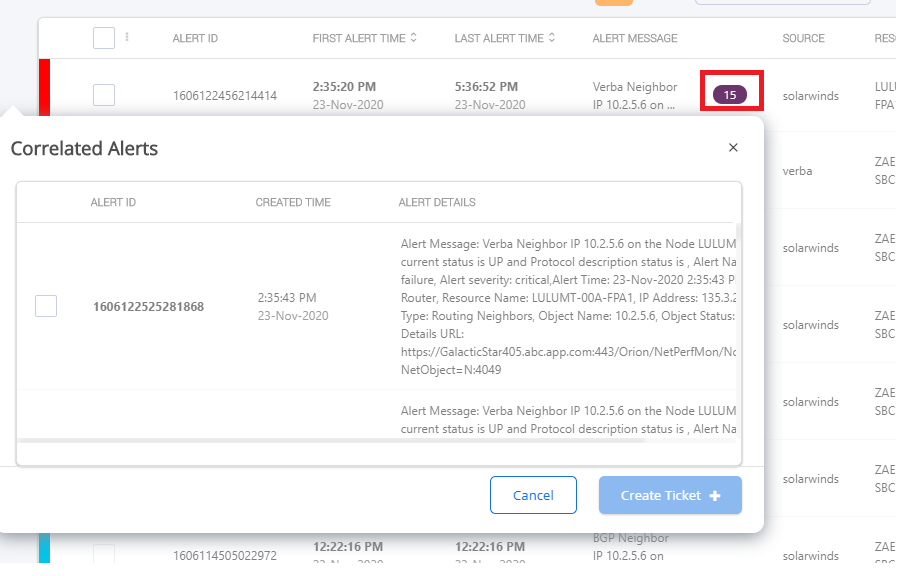
-
To create a ticket, select the required alerts and click on Create Ticket.
Managing Ticket Status
ITOPs PWF enables the ITOPs Engineer users to review and assign tickets/alerts to users, as per requirement.
To manage/assign tickets, perform the following:
-
Login to SmartOps ITOPs as an ITOPs Admin user. This displays the ITOPs dashboard as shown in FigureFigure.
Note: The dashboard corresponding to the saved/favourite project is displayed, by default. -
Click Alert tab. This displays the Alerts screen as shown in FigureFigure.
This lists the alerts and corresponding details. -
Click on the icon corresponding to the alert as shown in FigureFigure.
-
Click on Assign to assign the alert to respective engineer users.
-
Click on Close to close the alert.
-
Click on Acknowledge to acknowledge the alert.