Managing Alerts
Alert Console in ITOps is the area within the application which displays alerts and provides functionalities to take action on the alerts.
Contents
Viewing Alert List
To view alerts corresponding to a project, perform the following steps:
-
Login to SmartOps ITOPs as an ITOPs Admin user. This displays the ITOPs dashboard as shown in FigureFigure.

Note: The dashboard corresponding to the saved/favourite project is displayed, by default. -
Click Alert tab. This displays the Alerts screen as shown in FigureFigure.
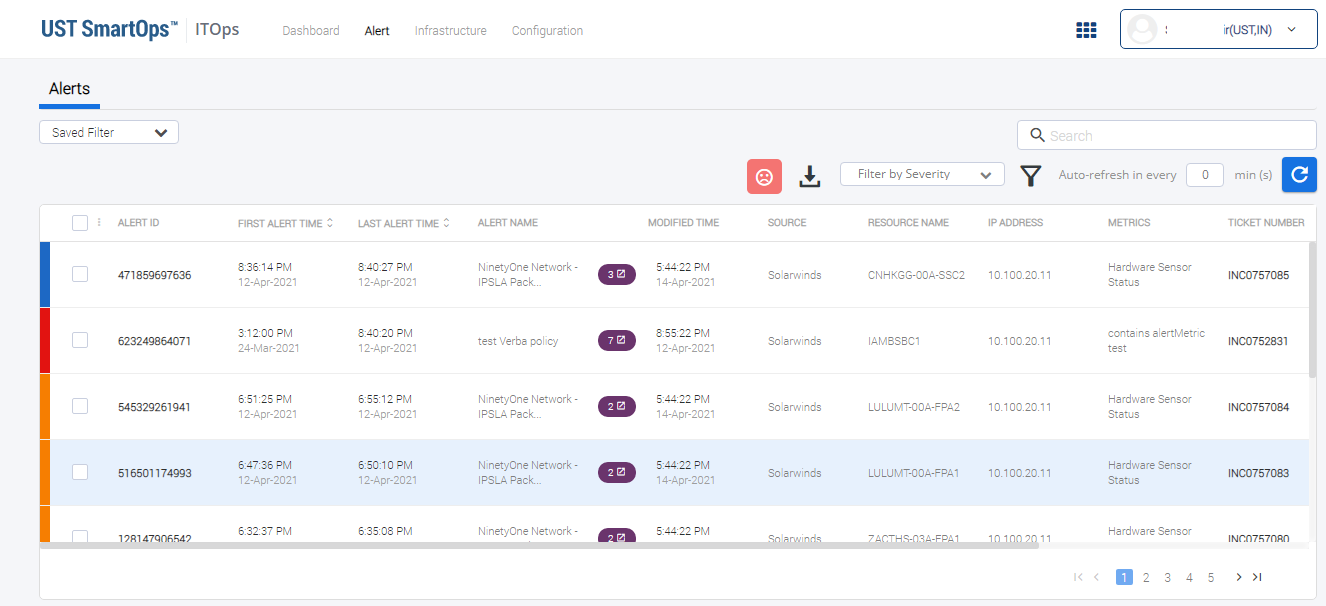
This lists the alerts and corresponding details. -
To view additional details about the tickets, click on the
 icon corresponding to the ticket. This expands the row with details such as shown in FigureFigure.
-
To assign an alert to respective users click on the expand icon corresponding to the alert as shown in FigureFigure.
-
Click on Assign to assign the alert to respective engineer users.
-
Click on Close to close the alert.
-
-
To download an alert, click on
 icon. This displays the dialog box as shown in FigureFigure.
-
Click Alert Report link to download the alert report.
-
To download alert processing report, select the required date range and click Alert Processing Report.
-
-
You may search for the required alert from the Search field.
-
You may filter the required alert based on severity from the Filter By Severity field. Severity includes Warning, Ok, Critical, Information, Major, and Minor.
-
You may specify the interval for auto refresh in the Auto refresh in every (mins) field.
Viewing Severity of the Alerts
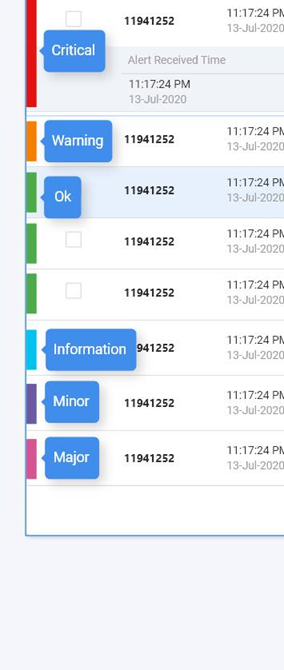
ITOPs PWF enables to visually identify the severity of alerts in Alert Listing so that user can quickly identify the alerts that needs urgent attention. Severity of alerts is identified as follows:
-
Ok – Green
-
Warning – Orange
-
Information – Blue
-
Major – Magenta
-
Minor - Purple
-
Critical – Red
If a cluster has only a single device, following conditions are considered for setting the severity of the cluster.
1) Alerts are sorted based on the alert created time (source created time if available, else as available in iHub)
-
If there is only one alert with latest created time, severity is set as cluster severity
-
If there are multiple alerts with latest created time, then sorted with requestReceived time.
-
If there is only one alert with latest requestReceived time, then severity is set as cluster severity
-
If there are multiple alerts with latest requestReceived time, then follows the following rules:
-
Rule1: Checks whether there are recovery alerts. If there is alert recovery alerts, set the highest severity (among recovery alerts) to the cluster.
-
Rule2: If there are any non-recovery alerts, set the highest severity (among non-recovery alerts) to the cluster.
-
-
If the cluster have multiple devices, latest severity for that particular device is shown using the above conditions for each device and sets the highest severity among these to the cluster.
Sort by Severity
Alerts available in the Alert listing page can be filtered based on severity of the alert.

To filter based on severity, select the required severity from the drop-down menu. The list will be refreshed based on the severity selected. Severity includes Warning, Ok, Critical, Information, Major, and Minor.
Refresh/Auto Refresh feature
An ITOPs Administrator or ITOPs engineer is enabled with the feature to specify the refresh interval of alert listing page so that the list page displays latest information.
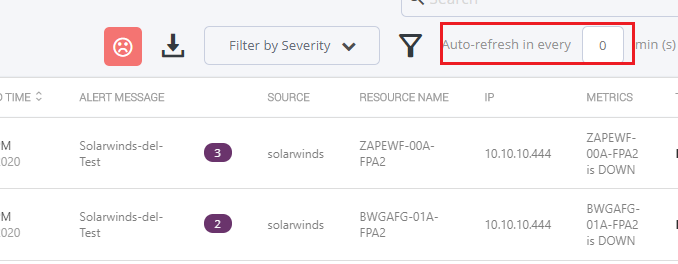
To define auto refresh interval, enter the duration (mins) and click on the ![]() icon.
icon.
Advanced Filter
An ITOPs Administrator or ITOPs engineer can filter an search for alerts using Advanced Filter feature.
An ITOps user is enabled with the capability to save a filter as default so that the user need not re-apply the filter condition at each login. ITOps user will also have the provision to save a filter as "Favourite".
Only created user or ITOps admin will be able to edit or delete a saved filter.
To filter alerts, click on ![]() . This displays the Advanced Filter window as shown in FigureFigure:
. This displays the Advanced Filter window as shown in FigureFigure:

Select the required filter(s), as per requirement. The fields and description is available in the table below:
|
Fields |
Description |
|
Source and Resources |
|
|
Source |
Select the name of the source. |
|
Resource Name |
Enter the name of the resource. |
|
State and Status |
|
|
Alert Severity |
Select the severity of the alert. Severity available are:
|
|
Alert State |
Select the alert state. Alert states available are:
|
|
Incident Status |
Select the required incident status. Status available are:
|
|
Cluster Type |
Select the required cluster type. Cluster Types available are:
|
|
Assignment |
|
|
Assigned To |
Select the required assignee from the list. |
|
Assigned Group |
Select the required assignment group. |
|
Date and Time |
|
|
From |
Select the date from which filter is to be performed. |
|
To |
Select the date to which filter is to be performed. or Select the period in last duration. |
Save the filter, if you require to save the filter comditions. Once saved, the saved filters will be available on the left pane.
Facility to download alerts
An ITOPs Administrator or ITOPs engineer is enabled with the capability to download alerts as .CSV file.
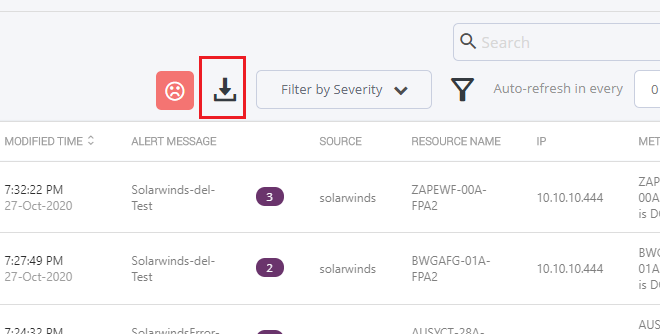
To download alerts, click on the Download icon to download the file. This displays the dialog box as shown in FigureFigure.
-
Click Alert Report link to download the alert report.
-
To download alert processing report, select the required date range and click Alert Processing Report.
Viewing Correlated Alerts
ITOPs PWF enables to correlate related alerts to an existing alert and display as a single line item.
To view the correlated alerts, perform the following steps:
-
Login to SmartOps ITOPs as an ITOPs Admin user. This displays the ITOPs dashboard as shown in FigureFigure.
Note: The dashboard corresponding to the saved/favourite project is displayed, by default. -
Click Alert tab. This displays the Alerts screen as shown in FigureFigure.
This lists the alerts and corresponding details. -
Correlated Alerts with be displayed as a single line item as shown in FigureFigure.
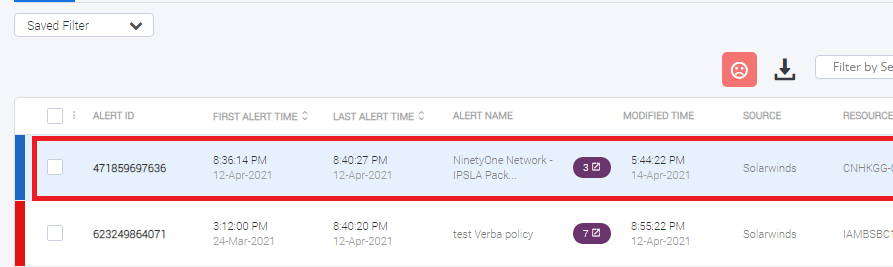
Note: Severity corresponding to a cluster indicates the severity the last ticket in the cluster. -
Click on the number of alerts to view the list of correlated alerts as shown in FigureFigure.

In the Correlated Alerts window, you can view the following details related to alerts:-
Alert ID: Unique identifier corresponding to the alert.
-
Created Time: Time of alert creation (This includes Date and Time)
-
Alert Details: Details corresponding to the alert.
To view the log details related to each alert, click on
 icon corresponding to the alert.
 -
-
To create a ticket, select the required alerts and click on Create Ticket. A message "" Cluster Split Success" will be displayed.
Managing Ticket Status
ITOPs PWF enables the Admin users to review and assign tickets/alerts to users, as per requirement.
To manage/assign tickets, perform the following:
-
Login to SmartOps ITOPs as an ITOPs Admin user. This displays the ITOPs dashboard as shown in FigureFigure.
Note: The dashboard corresponding to the saved/favourite project is displayed, by default. -
Click Alert tab. This displays the Alerts screen as shown in FigureFigure.
This lists the alerts and corresponding details. -
Click on the icon corresponding to the alert as shown in FigureFigure.
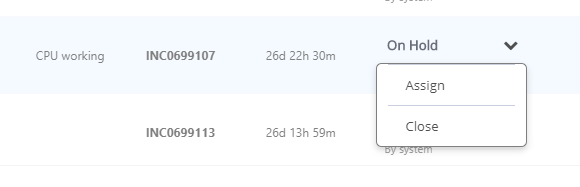
-
To assign a ticket to self, select Assign from the drop-down menu.
-
To assign a ticket to others user or group, click on the corresponding ticket number. This displays the window as shown in FigureFigure.

-
To assign to a group, select from from Choose an Assignment group field.
-
To assign to a team member, select from Choose a Team Member field.
-
-
To close a ticket, select Close from the drop-down menu.
-
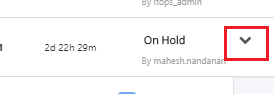
To hold an assigned ticket, select Hold from the drop-down menu.
Managing Auto Closure and Alert Flapping
Auto Closure
SmartOps allows organisations to specify conditions for auto closure of clusters. System will identify the alert as recovery if it meets the criteria set in Recovery Policy. Alerts meeting the recovery policy criteria will be considered for auto closure.
If all the attributes specified in the auto closure condition has identical value in a cluster, then that cluster will be auto closed. Tickets with associated tickets will also be closed.
Attributes checked for auto recovery are:
-
Source
-
Resource Name
-
Object Name
-
Metric
-
IP Address
-
MAC address
-
Resource Group
-
Resource Type
Alert Flapping
Flapping can be defined as an event where repeated down and up alerts are generated by a source system on the same resource, object or a combination of both over a time period.
Along with auto closure conditions, organizations can specify if the clusters auto-closed based on set conditions should be checked for flapping patterns:
If 'Yes' following additional parameters needs to be captured:
-
Number of Closed cluster
Number of closed clusters containing only down, up pair of alerts matching the rule conditions -
Time Interval
Time interval for detecting or auto closing flapped clusters
If set number of closed clusters are detected by system with in the time interval, the subsequent cluster having down up pair will be marked as 'Flapped' cluster.
-
System will not close any flapped cluster even if it receives an 'Up' alert.
-
A flapped cluster is eligible for auto closure only if the time interval set has elapsed after receiving last down, up pair of alerts matching the condition
Updating Ticket in case of flapped event:
-
System will update a comment " System has identified a flap event on this device at <time_of_alert>"
-
System will update each of the subsequent alert in the ticket
-
Once the time interval set has elapsed system will update the ticket with comment 'This device seems to be recovered from flapping, during the event of flapping a total of <number of alerts> has been received'.
Auto Closure and Alert Flapping Configurations
To configure Auto-closure and Alert Flapping configurations, follow the steps below:
-
Invoke the Add Alert Policy API with following parameters as shown in FigureFigure.
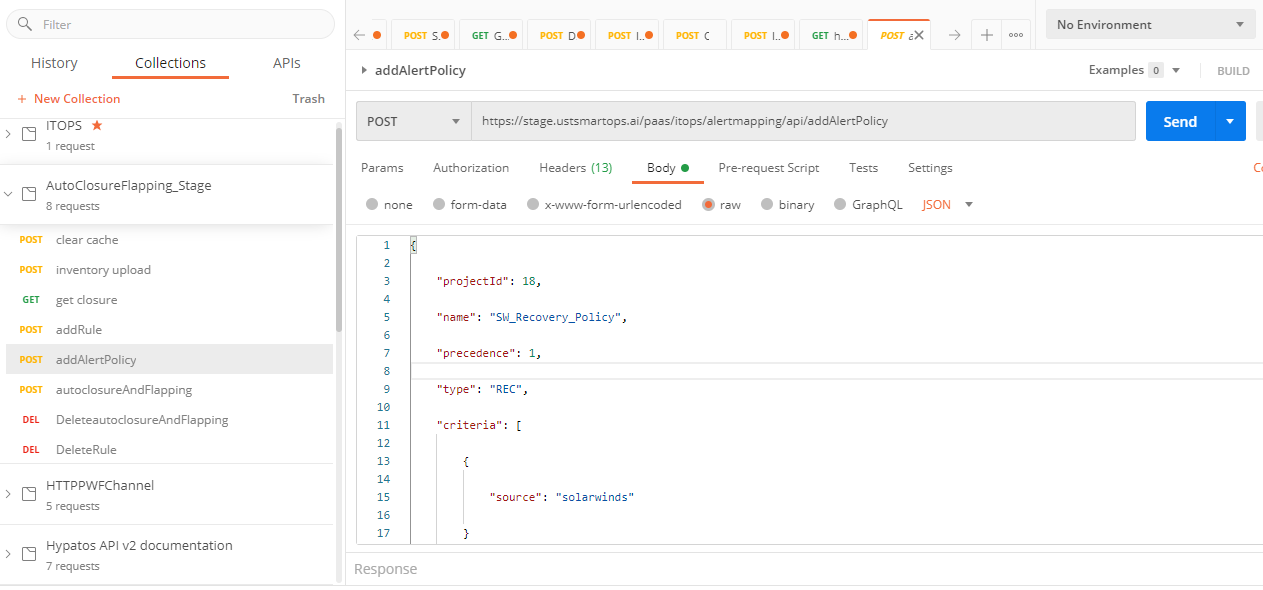
Project ID: Id of the projectname: Name of the recovery policy
precedence: precedence value for the policy.
type: "REC"
criteria: Criteria for the recovery policy.
-
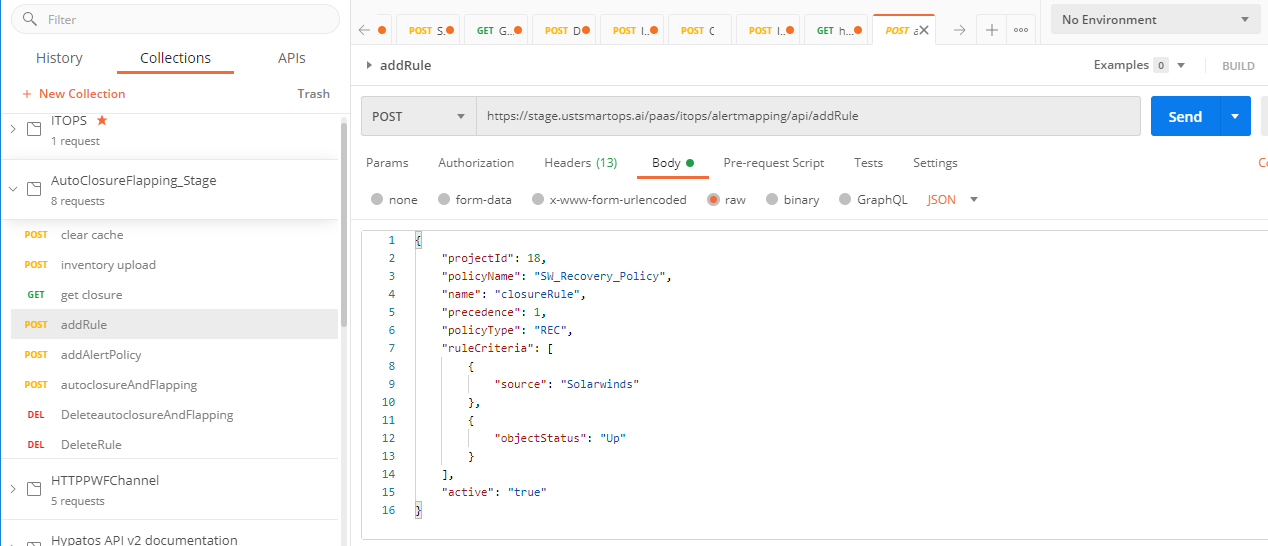
Invoke the AddRule API with following parameters as shown in FigureFigure.
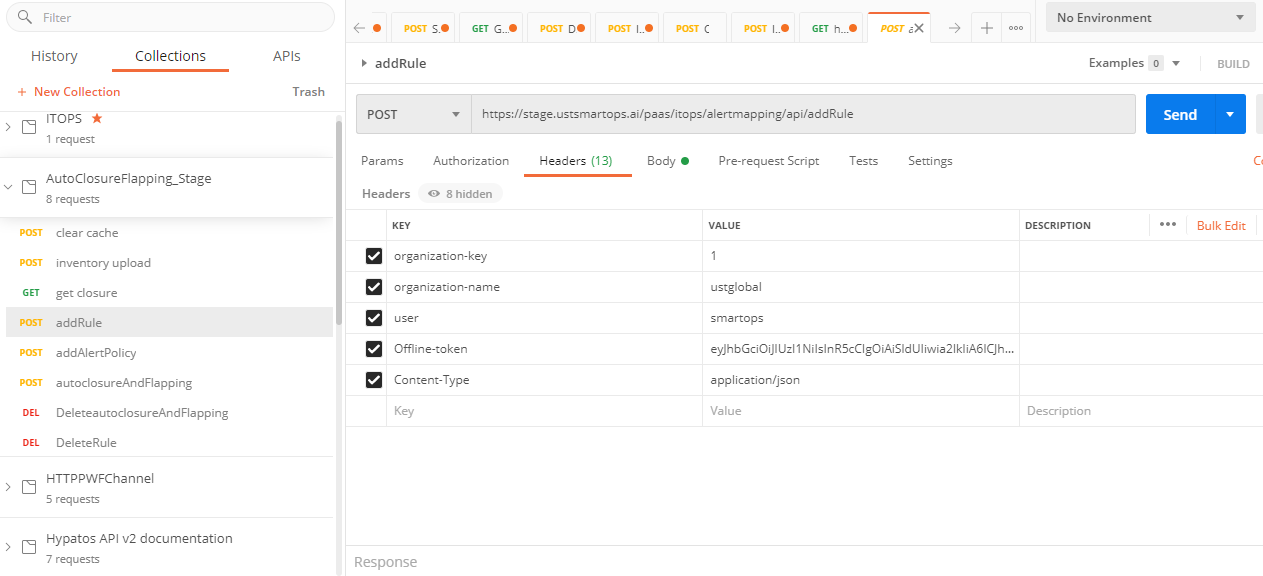
Header Parameters:-
organization key
-
organization name
-
user
-
Offline-token
-
Content Type
Body Parameters:
-
Project ID: Id of the project.
-
policyname: Name of the recovery policy.
-
name: Name of the closure rule.
-
precedence: precedence value for the policy.
-
policytype: "REC"
-
rulecriteria: Criteria for the recovery policy.
-
-
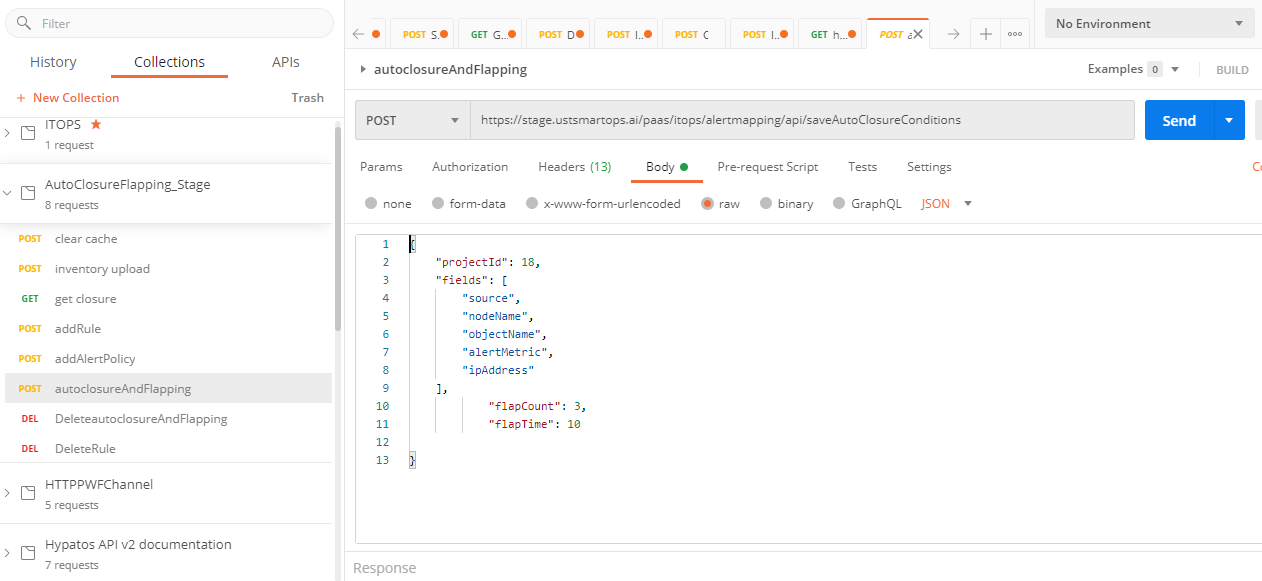
Invoke the Autoclosure and Flapping API with following parameters as shown in FigureFigure.
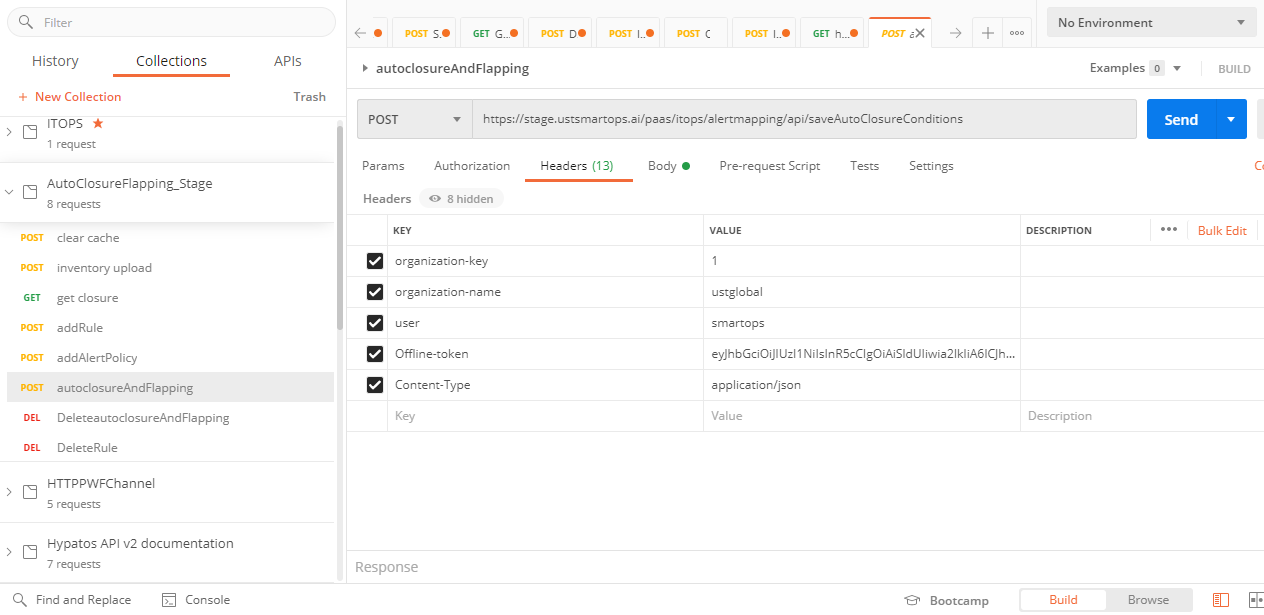
Header Parameters:
organization key
organization name
user
Offline-token
Content Type
Body Parameters:
Project ID: Id of the project
fields: fields to be checked for autorecovery.
flapcount: Number of closed clusters to be considered for autoclosure.
flaptime: Duration to be considered for autoclosure.