Managing Alert Configuration Settings
Managing Alert Configuration Settings consists of:
Contents
Defining Severity Mapping
To define severity mapping, perform the following:
-
Login to SmartOps ITOPs as an ITOPs Admin user. This displays the ITOPs dashboard as shown in FigureFigure.

Note: The dashboard corresponding to the saved/favourite project is displayed, by default. -
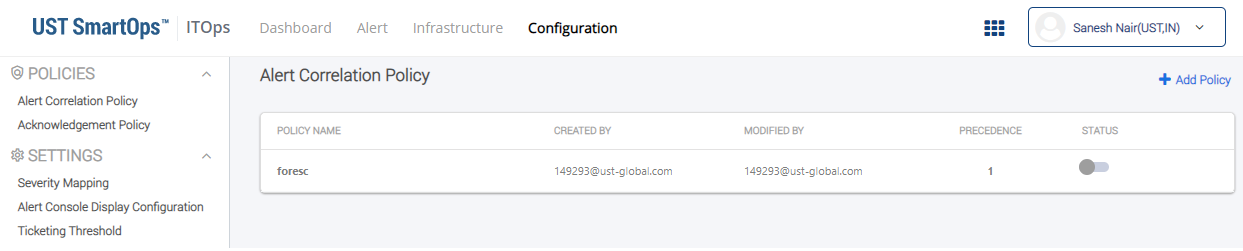
To navigate to Infrastructure, click Configuration tab. This displays the Alert Configuration Policy screen as shown in FigureFigure.
-
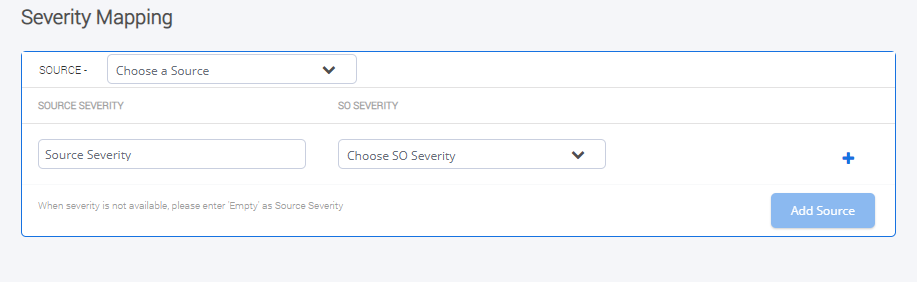
Click on Severity Mapping. This displays the Severity Mapping block as shown in FigureFigure.
-
Define the severity mapping as explained below:
Field Name
Description
Source
Name of the source
Source Severity
Severity definition available in source
SO Severity
Corresponding SO severity.
-
To add another source definition, click
 icon.
icon. -
To save the definition, click Add Source button.
Defining Alert Console Display Configurations
An ITOps Admin is enabled with the privilege to decide the fields that should be displayed in the 'More' section in the alert console so that Admin user can enable new fields from the source part of the console. In addition, ITOps Admin users is enabled with the provision to provide the display name and display order.
To define the display parameters of Alert Console, perform the following:
-
Login to SmartOps ITOPs as an ITOPs Admin user. This displays the ITOPs dashboard as shown in FigureFigure.
Note: The dashboard corresponding to the saved/favourite project is displayed, by default. -
To navigate to Infrastructure, click Configuration tab. This displays the Alert Configuration Policy screen as shown in FigureFigure.
-
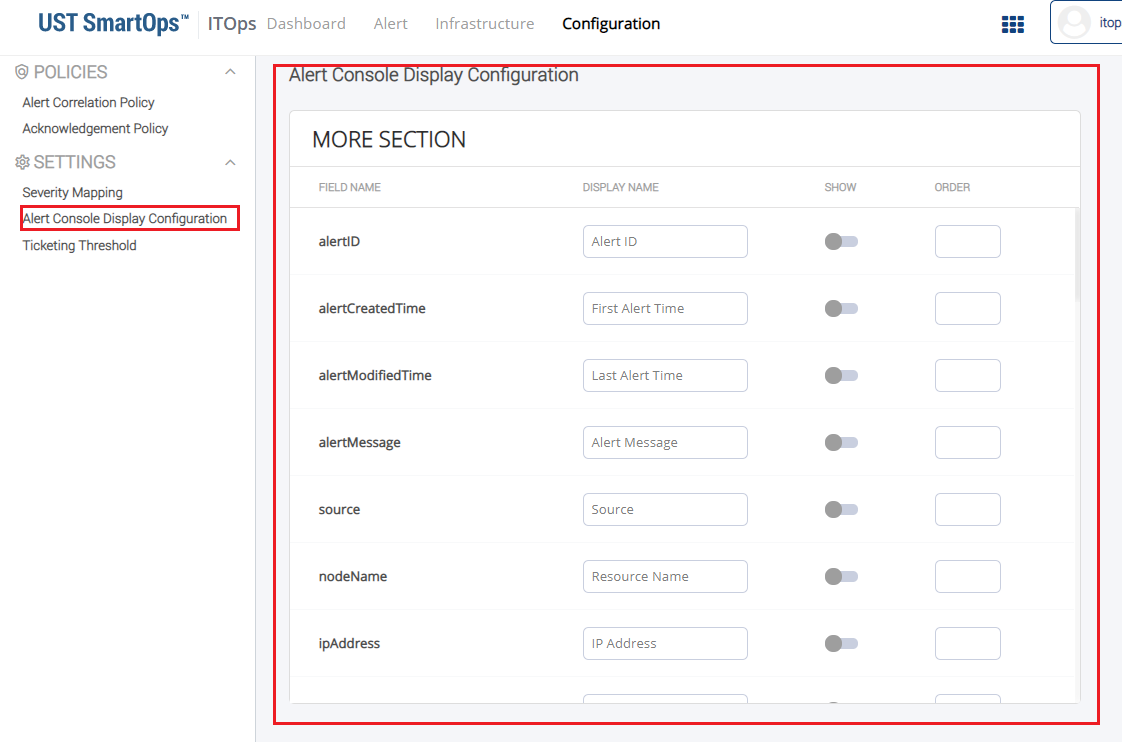
Click on Alert Console Display Configuration. This displays the Alert Console Display Configuration block as shown in FigureFigure.
-
Define the parameters as explained below:
Field Name
Description
Field Name
Name of the field.
Display Name
Name to be displayed for the field in the UI.
Show
Whether to enable the field in Alert Console.
Order
Order in which the field is to be displayed in the Alert Console.
-
To save the configurations, click Save.
Defining Ticketing Threshold
ITOps Admin users will be able to use Alert Cluster Size and duration, so that once the threshold cluster size is reached within the time window, ticket will be automatically created. User will be able to specify cluster size and duration for each source. 'Rolling Time Interval' is considered for ticketing threshold. For example, consider a scenario where cluster size is specified as 3, and interval as 10min. System will check whether 3 alerts have been received within 10 mins prior to each alert. If available, the alerts will be clustered.
User will be able to add only one configuration per source.
To define the ticketing thresold, perform the following:
-
Login to SmartOps ITOPs as an ITOPs Admin user. This displays the ITOPs dashboard as shown in FigureFigure.
Note: The dashboard corresponding to the saved/favourite project is displayed, by default. -
To navigate to Infrastructure, click Configuration tab. This displays the Alert Configuration Policy screen as shown in FigureFigure.
-
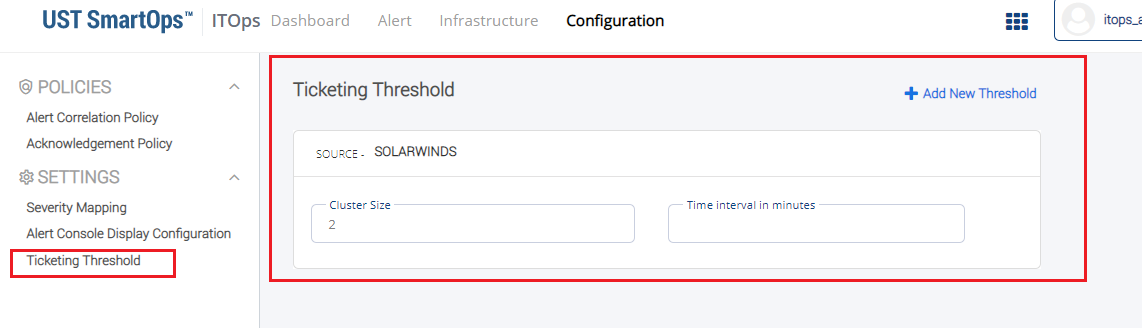
Click on Ticketing Threshold. This displays the Ticketing Thresold block as shown in FigureFigure.
-
To add a new threshold definition, click on Add New Threshold.
-
Define the parameters as explained below.
Field Name
Description
Source
Source for which threshold value is to be defined.
Cluster Size
Total number of alerts allowed within the cluster.
Time interval (in minutes)
Rolling Time Interval to be considered.