Managing Admin Dashboard
Dashboard enables to view and manage various widgets to be displayed for the ITOPs Admin. This dashboard is powered using Grafana.
To access a project dashboard, perform the following steps:
-
Login to SmartOps ITOPs as an Admin user. This displays the ITOPs home page as shown in FigureFigure
. 
Note: The dashboard corresponding to the saved/favourite project is displayed, by default, if any one of the project is saved as favourite.
-
Navigate to the Project Listing page from the home page as shown in FigureFigure.

This displays the project listing page as shown in FigureFigure .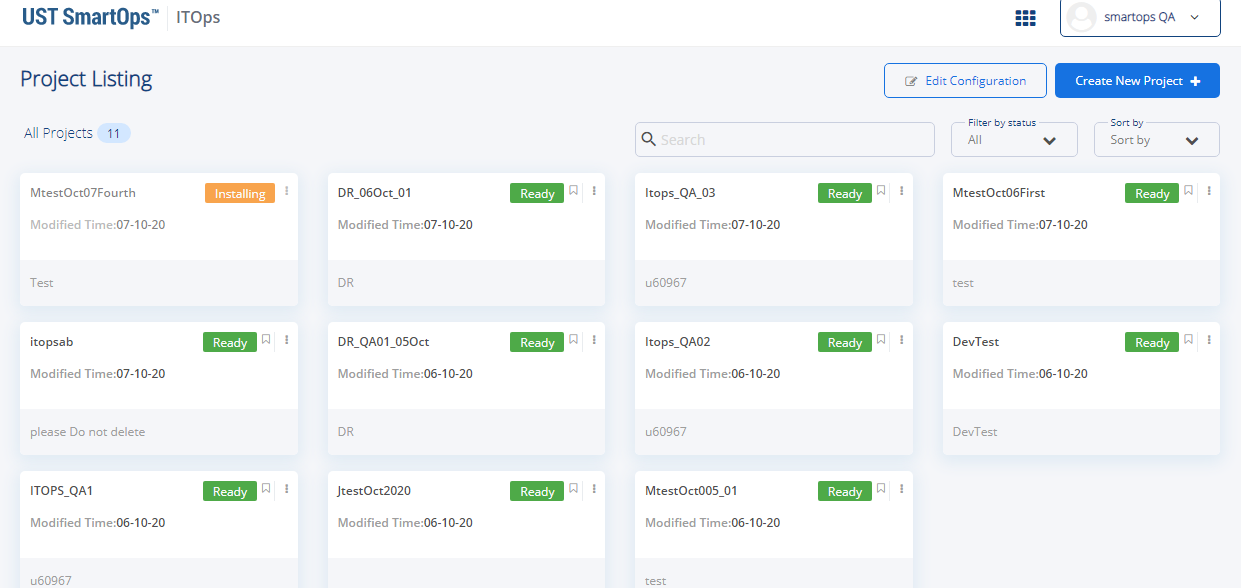
-
You may search for the required project from the Search by project name field.
-
You may filter the required project based on status from the Filter By status field.
-
You may sort the projects based on “modified date” or “project name” from the Sort By field.
-
-
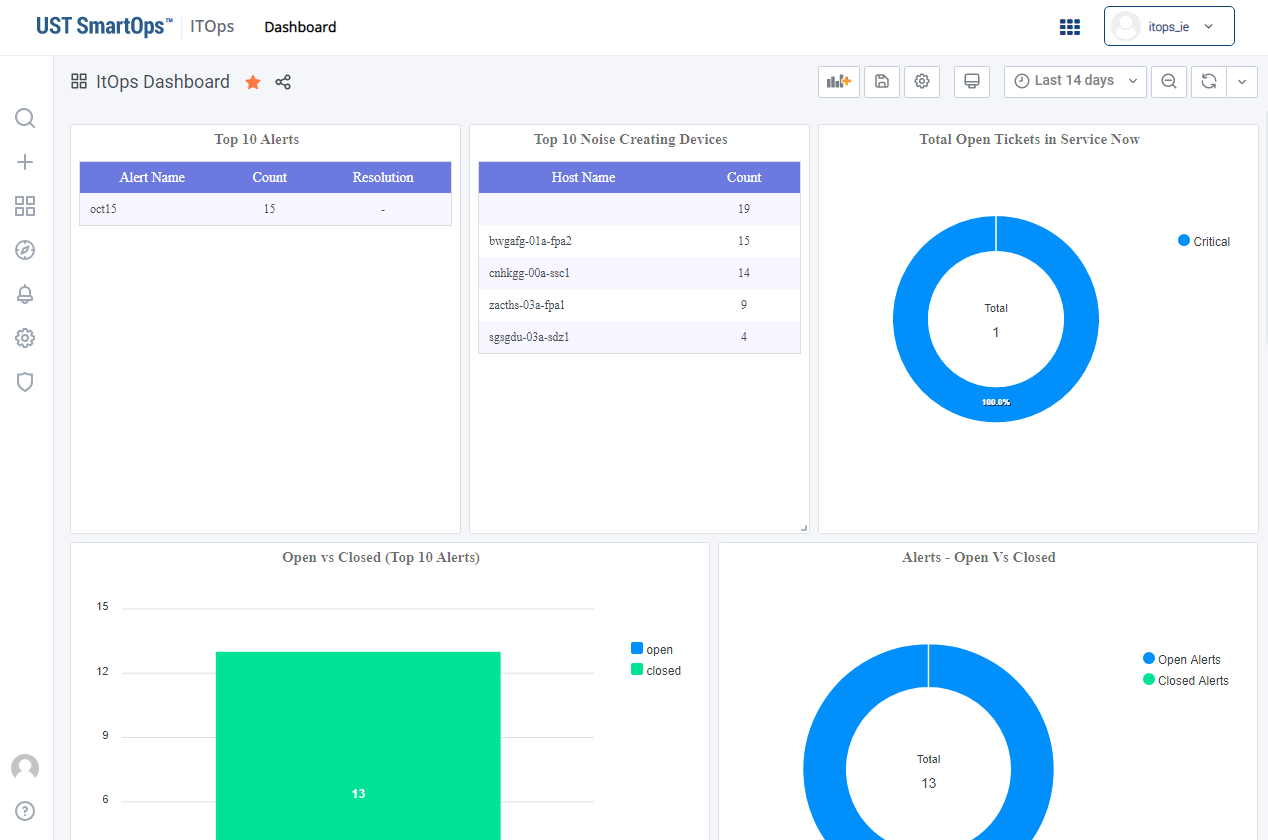
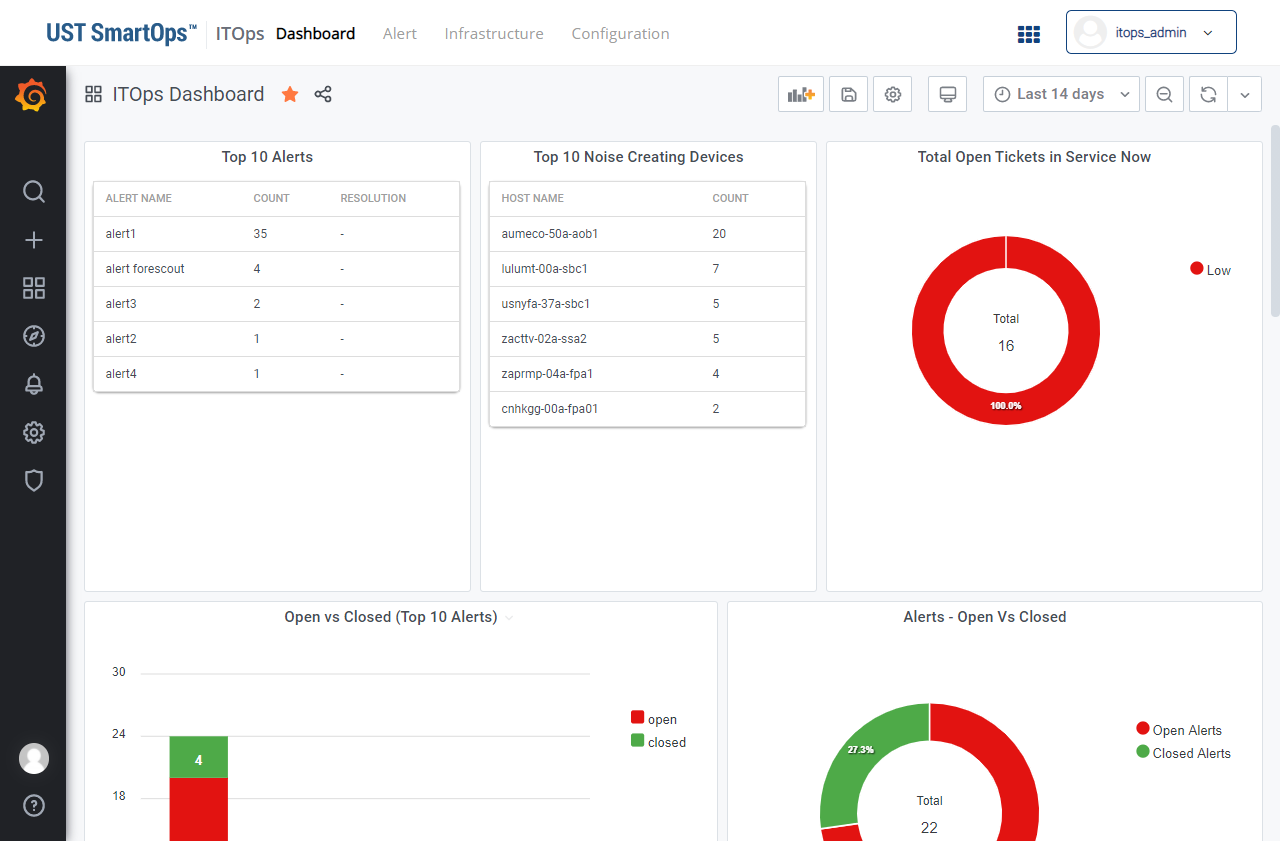
Click on the project. This displays the corresponding Dashboard as shown in FigureFigure.
The dashboard showcases metrics related to the following:
-
Top Ten Alerts: Name of the alerts ranked according to number of occurrences.
-
Top Ten Noise Creating Devices: Name of the rresources ranked in the order total number of alerts generated by them.
-
Total Open Tickets in Service Now: Name of the open tickets in service now.
-
Open vs Closed (Top Ten Alerts): Top ten alert clusters which are open vs Closed.
-
Alerts Open vs Closed: Total alert clusters which are open vs Closed.
-
Mean Time to Repair: Mean Time to Repair (MTTR) ccalculation is Total Maintenance Time / Total Number of Repairs. In ITOPs Total Time taken by tickets to move to Closed/ Total number of tickets calculated for 24 Hrs
-
Alert Trend: Trend of Top 10 (Minimum 3) alert names over time period of a week
-
Resolution SLA:
-
Alert Pattern: Alert pattern is visualized as a heat map intensity distribution of total number of alerts for each type of alert reported on a day based scale.
-
Source Device Mapping: Displays details such as:
-
Total number of alert
-
Source from which alerts originate from
-
Device which has reported the alert
-
Severity of the alerts that has been reported.
-