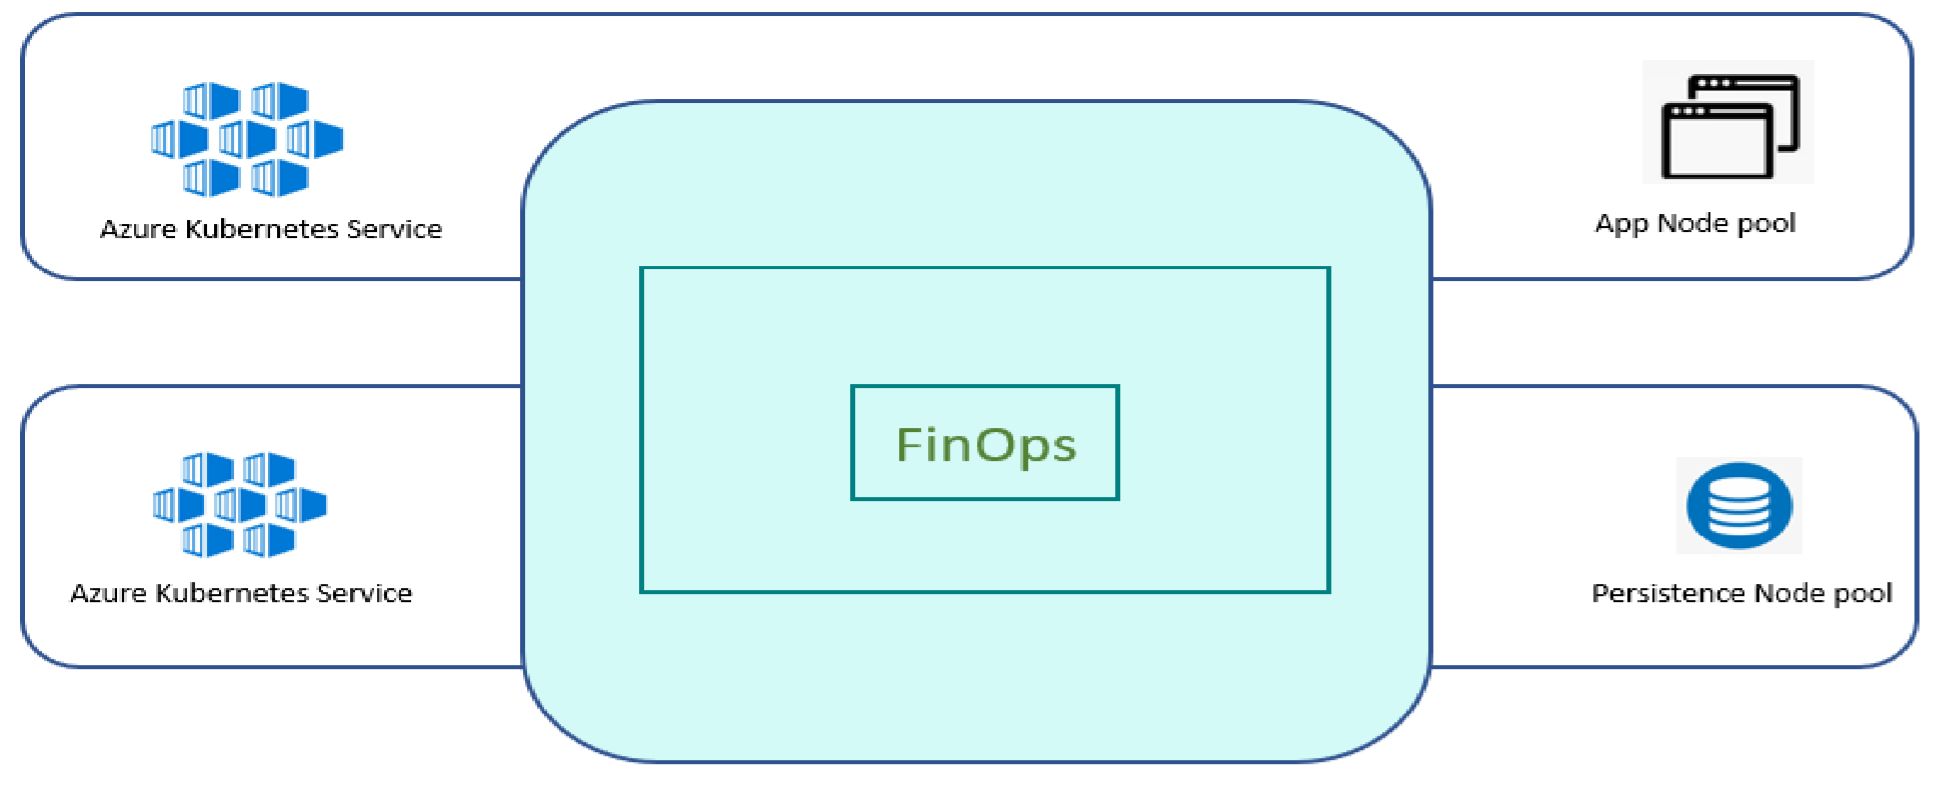
Performance test was conducted for SmartOps Kubernetes based Infrastructure hosted in Azure Cloud. Test environment was deployed with Smart Extract pipeline and its related containers only. Vespa pipeline and its related containers are excluded in this test executions.
The below table summarizes the hardware Infrastructure along with Node count used for the Smart Extract infrastructure.
|
Kubernetes Nodes |
Hardware Infrastructure |
Node Count |
|
|
Min |
Max |
||
|
Application Node Pool Components DU (Smart-extract, smart-extract-predict, rest, pipeline, scheduler, invoice-split, page-split , invoice-image-ocr), Clones Engine, pwf-invoice-extraction-scheduler, pwfinvoice-extraction-listener, pwf-invoice-extraction-api, ie-ui |
Azure D8sv3 CPU - 8 vCPU Core RAM: 32 GB |
4 |
6 |
|
Persistent Pool Components Mongo, MinIO, RabbitMQ, Elastic Search, Kibana |
Azure D4sv3 CPU - 4 vCPU Core RAM: 16 GB |
3 |
6 |
|
MySQL |
Azure Managed MYSQL |
|
|
|
|
General Purpose, 2 Core(s), 8GB RAM, 100 GB (Auto Grow Enabled) |
NA |
NA |
DATABASE & MESSAGE BROKER
Following are the details of replicas configured for Database & Message Broker in Kubernetes cluster MySQL is deployed as a Managed service at Azure.
|
Stack Name |
Container Name |
No of instances |
||
|
Database |
mongo |
3 |
||
|
minio |
2 |
|||
|
|
|
|||
|
|
elasticsearch |
3 |
||
|
mysql |
Azure Managed Service |
|||
|
Message Broker |
rabbitmq |
3 |
||
AUTOSCALABLE POD CONFIGURATION
Following are the CPU threshold limits, Replicas (Minimum & Maximum) configured for each component identified for Autoscaling in Kubernetes cluster for FinOps.
SMART EXTRACT CONTAINER CONFIGURATION
Based on the optimal Invoice processing observed in previous tests, Smart Extract Engine and Invoice Image OCR POD replicas are set to 3. All the tests are conducted with this configuration.
|
Smart Extract Engine |
Invoice Image OCR |
||
|
3 |
3 |
||
|
1.4. |
DU COMPONENTS & AUTOSCALE CONFIGURATIONS |
||
The below table provides details of docker containers of different components associated with FinOps from Document Understanding (DU), Clones, PWF, Database & Message Broker.
This also provides detail of components identified for Autoscaling and the criteria defined for Autoscaling. As part of ensuring availability of non-scalable components to avoid failures of any components during document processing, 2 instances of each components are by default available in the Kubernetes cluster.
|
Stack Name |
Container Name |
Autoscaling Enabled |
Scaling Criteria |
|
Document Understanding |
du-rest |
Y |
Based on CPU Usage |
|
du-scheduler |
N |
|
|
|
du-pipeline |
Y |
Based on CPU Usage |
|
|
du-invoice-split |
N |
|
|
|
du-tilt-correct |
N |
|
|
|
du-smart-extract |
N |
|
|
|
du-invoice-image-ocr |
N |
|
|
|
Clones |
clones-sense-queue |
N |
|
|
|
|
|
|
|
|
clones-engine |
Y |
Based on CPU Usage |
|
PWF |
pwf-Invoice-extractionlistener-du |
N |
|
|
pwf-invoice-extractionlistener |
N |
|
|
|
pwf-invoice-extraction-api |
N |
|
|
|
pwf-invoice-extractionscheduler |
N |
|
DU PROJECT CONFIGURATION
DU Project configuration settings
|
DU Project setting |
Value |
|
Engine Pipeline |
Smart Extract |
|
Language Classifier |
Disabled |
|
Feedback Learning (HITL) |
Disabled |
|
Preprocessors Enabled |
Barcode Page Split, Skip Dup Validation |
PERFORMANCE TESTING – SOFTWARE USED
Following Tools used as part of performance testing
|
Tool |
Version |
Description |
|
JMeter |
5.1.1 |
Implementing Performance testing |
|
Prometheus |
|
Capture resource utilization on server side. |
|
Grafana |
|
Dashboard to view resource utilization. |
|
Microsoft Excel |
|
Analyzing test results &reports. |
|
SmartVision |
2.3 |
SmartOps SmartVision application. |
TEST DATA AND TEST APPROACH
Three test items are identified in this release. Test data used and the approach for each test is detailed in each section below.
51 INVOICE TEST
Test is executed using Invoice samples of 51 per batch zip, each Invoice has 2 pages the first page being the Invoice scan page and second page is the invoice page. Different vendor-based sample invoices are used consisting of Invoices of different complexity categorized as low, medium, and high.
|
Batch file parameter |
Value |
|
Pages per Invoice document. |
2 |
|
No of Invoices per batch in a zip file |
51 (102 pages) |
|
Invoice Batch |
3 different variants of Invoices of High, Medium, and low complexity |
|
Number of fields extracted per invoice |
22 |
|
Document Format |
|
|
Zip file contents (Combined, Individual). |
Combined PDF of Invoices |
|
Insight Fields |
14 |
|
Line Items |
8 |
Conduct a test using this invoice. Repeat the test for 3 iteration to verify the consistent result. Capture the test metrics and compare the result with the 7.2 test results.
ORG TEST
Single PDF invoices are used for this test and the configuration is as below. Each batch is a zip of 10 individual PDF files. Sample invoices from customer is used here.
|
Batch file parameter |
Org 1 |
Org 2 |
|
File type |
|
|
|
Invoice Batch |
Zip |
Zip |
|
Number of fields extracted per invoice |
22 |
22 |
|
Document Format |
|
|
|
File contents |
Individual PDF inside zip |
Individual PDF inside zip |
|
Insight Fields |
14 |
14 |
|
Line Items |
8 |
8 |
Create two organization and create one set of projects in pwf and DU. Schedule a batch of (10 invoices) invoice doc with a time interval of 5 minutes in both pwf projects. Update the FTP with other batch file every 5 minutes interval. A total of 15 such invoice batches are configured to execute from each ORG. A total of 150 invoices from each ORG (total of 300 in the system). Run the test until completion of files processing in both the organizations. Collect the test result and analyze the system performance.
Repeat the same test with different time interval of 10 mins.
MULTI MODEL TEST
This is like 2 ORG test. In this test, we will again consider more customized setting in the DU Project configuration like ‘locale’ which decides the model to be considered in processing the invoice documents.
’US’ and ‘AUS’ locale will be considered as two models in each ORG.
UI TEST
This test is executed after the 2 ORG Test is completed. Invoices processed in 2 ORG is used for navigating UI actions to capture the UI/API time for navigation of different user actions. Below user actions are identified for this test and will be executed for a single UI user with a background load of 4 users accessing the server.
-
Insights page loading of pdf and insight data.
-
Navigate to next/previous invoice in the batch.
-
Save & Approve scenario.
-
Reject/Escalate scenario.
-
Point & Select
Performance test servers are hosted in east US region. Separate tests are executed from VM and from local (Kochi, South India). As the VM is hosted in the same region as the application server resides, there won’t be any delay for data transportation and switching of regions. Another test is conducted from local which is a different region than the servers.
PERFORMANCE TEST - SUMMARY
51 INVOICE TEST
Average time taken to process 51 invoices is 22.88 minutes.
|
Test Execution |
DU Time Taken (Minutes) |
|
|
First file processed |
Last file processed |
|
|
Test 1 |
4.00 |
22.97 |
|
Test 2 |
4.58 |
23.13 |
|
Test 3 |
3.33 |
22.55 |
Comparison between 7.2 and 2.3. The avg time taken to process 51 invoices is almost the same for both the versions.
|
Test
|
DU Time Taken (Minutes) |
|
|
|
7.2 |
|
2.3 |
|
|
51 invoices |
22.53 |
|
22.88 |
ORG TEST
Tests are conducted with the document upload configuration as ‘Every 5 minutes’, ‘Every 7 minutes’ and ‘Every 10 minutes. No invoice failed in the tests.
Throughput is calculated by adding the files processed in both the organizations together during a time interval. Throughput (number of invoices that can be processed in an hour) is observed as 119 invoices/hour for the 5 minutes schedule. The lesser throughput number 113 in ‘10 mins test’ is because of the idle time in DU services as most of the time the 10 files batch that is scheduled in each 10 minutes is completed its processing before the other set reaches the system. This idle time is also added up in the execution time which eventually reduces the throughput number.
|
Test Name |
Batch size |
Inv / ORG |
Total files |
Test Duration |
Effective time (secs) |
Throughput (Per Hour) |
||
|
300 inv_5 min |
10 |
150 |
300 |
9079 |
9096 |
119 |
||
|
|
|
|
||||||
|
|
10 |
150 |
|
9087 |
|
|
||
|
300 inv_7 min |
10 |
150 |
300 |
9150 |
9153 |
118 |
||
|
|
|
|
||||||
|
|
10 |
150 |
|
9140 |
|
|
||
|
300 inv_10 min |
10 |
150 |
300 |
9579 |
9579 |
113 |
||
|
|
|
|
||||||
|
|
10 |
150 |
|
9356 |
|
|
||
|
100 Inv_1 time |
50 |
50 |
100 |
2842 |
2842 |
127 |
||
|
|
|
|
||||||
|
|
50 |
50 |
|
1536 |
|
|
||
|
4.3. |
MULTI MODEL TEST |
|||||||
Two organizations ORG1 and ORG2 are configured with different DU and PWF projects like 2 ORG tests.
|
ORG |
Invoice Fields Locale |
Test schedule |
|
ORG1 |
US |
15 batches with 10 invoices in each batch. |
|
ORG2 |
AUS |
15 batches with 10 invoices in each batch. |
As both the projects are configured with different Locale, the ‘se_model_id’ will be different for them. The test execution result of this model is as below.
|
Test Name |
Batch size |
Inv / ORG |
Total files |
Test Duration |
Effective time (secs) |
Throughput (Per Hour) |
|
300 inv_5 min |
10 |
150 |
300 |
8809 |
8809 |
123 |
|
10 |
150 |
8804 |
||||
|
300 inv_10 min |
10 |
150 |
300 |
9485 |
9516 |
114 |
|
10 |
150 |
9433 |
||||
|
100 Inv_1 time |
50 |
50 |
100 |
2814 |
2814 |
128 |
|
50 |
50 |
1620 |
UI TEST
UI time is captured using a stopwatch manually during the 10 users load executed from the JMeter tool.
PDF view UI time taken from local machine during the 10 users load on the server.
|
|
Time in seconds |
|
||||
|
No throttling (Disabled) |
Fast 3G |
Slow 3G |
||||
|
User Action |
end-to-end |
API time |
end-to-end |
API time |
end-to- end |
API time |
|
PDF view - sample 1 |
3.34 |
1.97 |
3.43 |
2.27 |
4.85 |
4.14 |
|
PDF view - sample 2 |
1.93 |
1.44 |
2.41 |
2 |
5.19 |
4.15 |
|
PDF view - sample 3 |
2.22 |
1.42 |
2.81 |
2.16 |
4.93 |
4.16 |
|
PDF view - sample 4 |
2.26 |
1.69 |
2.28 |
1.88 |
6.83 |
4.11 |
|
PDF view - sample 5 |
2.16 |
1.62 |
3.18 |
2.13 |
5.15 |
4.15 |
|
PDF view - sample 6 |
2.43 |
1.57 |
2.59 |
1.34 |
4.51 |
4.09 |
PDF view UI time taken from virtual machine (VM) during the 10 users load on the server.
|
|
Time in seconds |
|
|
|||
|
No Throttling (Disabled) |
Fast 3G |
|
Slow 3G |
|||
|
User Action |
End-to-end UI Time |
API time |
End-to-end UI Time |
API time |
end-to- end |
API time |
|
PDF view - sample 1 |
1.26 |
1.2 |
4.08 |
1.17 |
7.12 |
4.25 |
|
PDF view - sample 2 |
1.26 |
0.948 |
2.22 |
1.3 |
4.66 |
4.2 |
|
PDF view - sample 3 |
1.7 |
1.19 |
2.27 |
1.17 |
4.36 |
4.25 |
|
PDF view - sample 4 |
1.32 |
0.936 |
2.07 |
1.2 |
4.57 |
4.23 |
|
PDF view - sample 5 |
1.88 |
1.48 |
2.39 |
2.22 |
4.74 |
4.23 |
|
PDF view - sample 6 |
1.4 |
1.04 |
2.06 |
1.19 |
4.48 |
4.12 |
DETAILED TEST RESULTS
51 INVOICE TEST
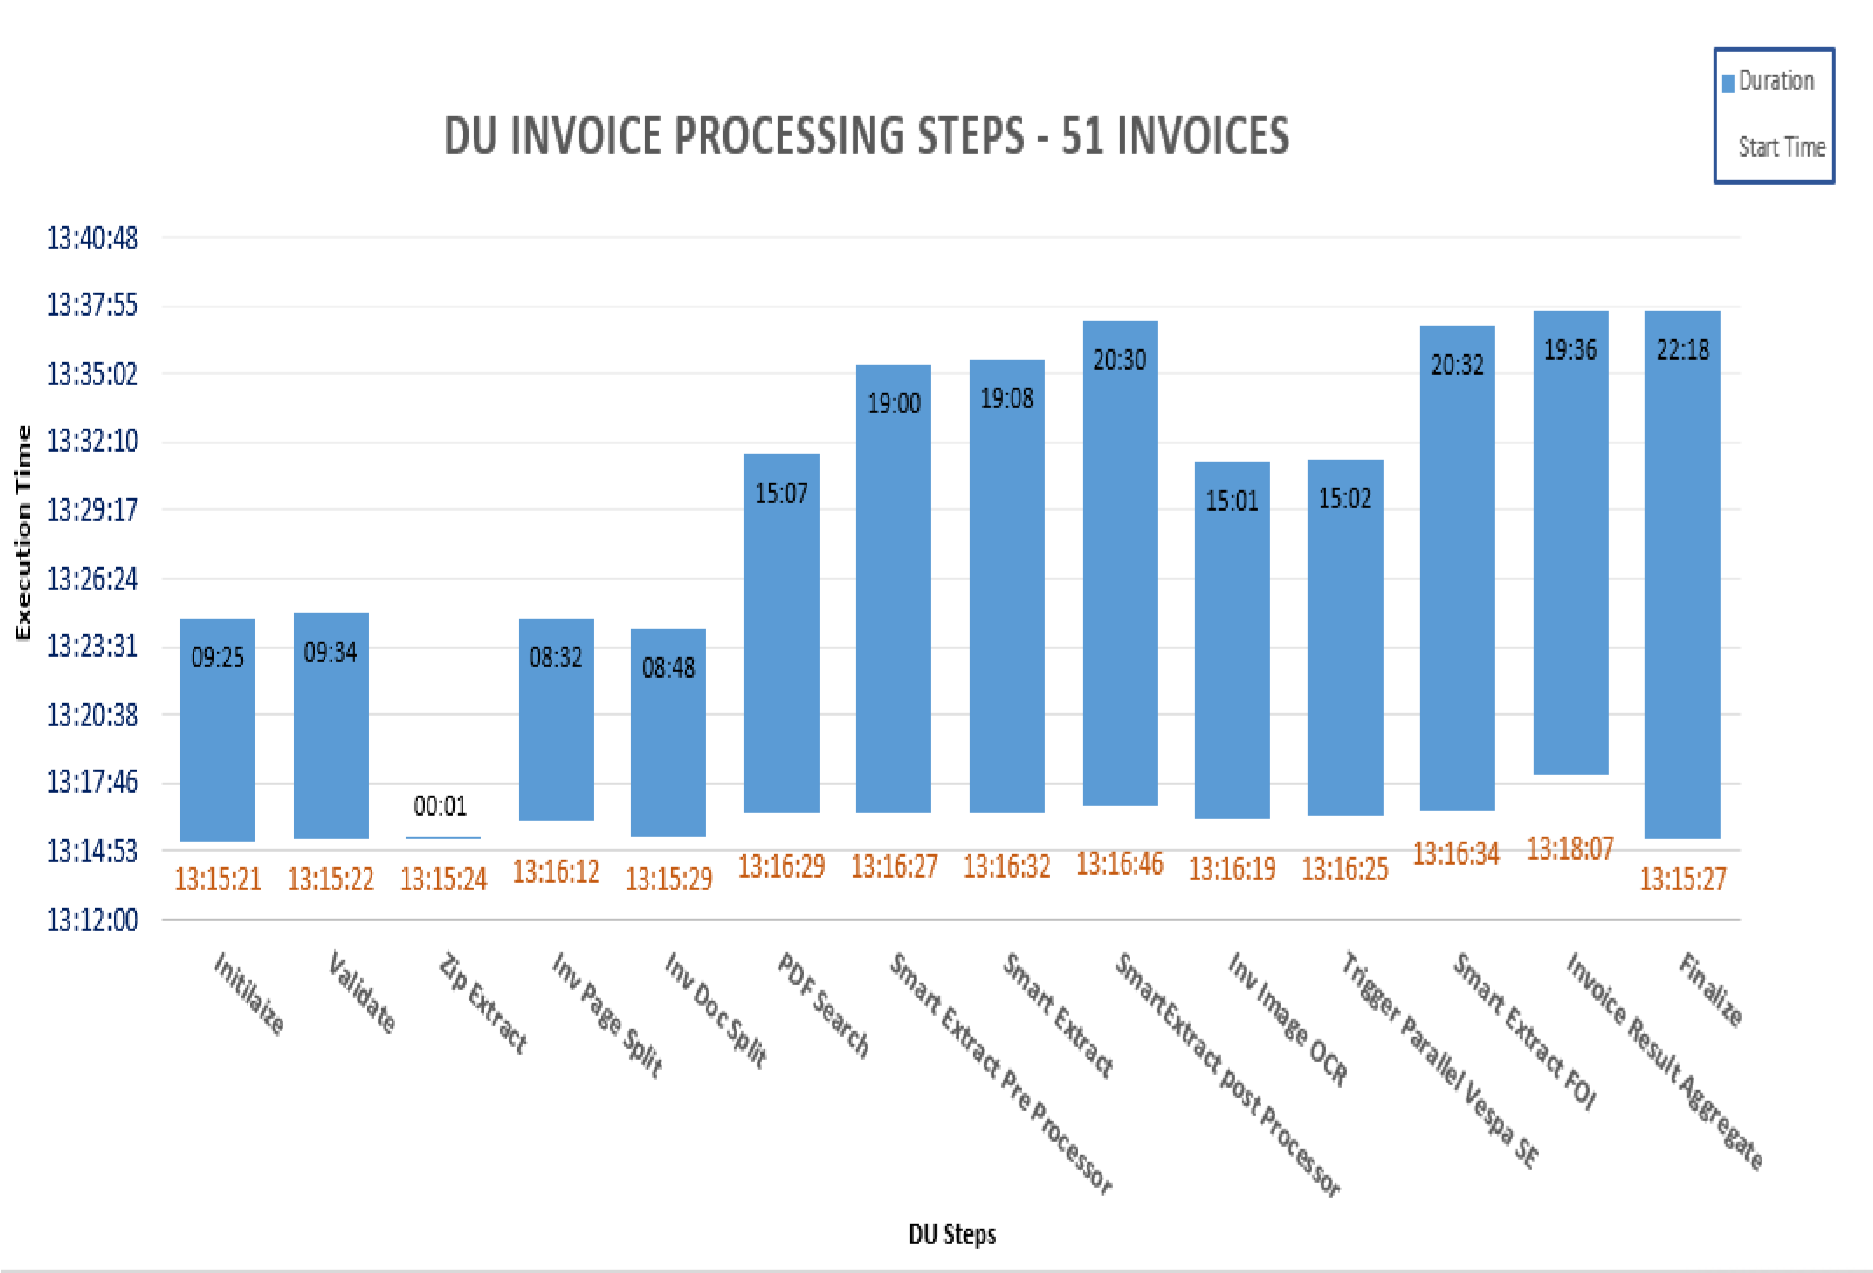
TIME BASED EXECUTION GRAPH
The following graph represents the time-based execution of the different steps of DU as part of the processing of the 51 Invoice sample for one of the test executions.
CLONES WORKFLOW – EXECUTION TIME
This is the time taken to execute the following workflow by clones engine as part of document processing.
-
Invoice_PWF_PushToDUSched is a scheduled workflow which polls the FTP folder to fetch the Invoice batch zip file and provides the zip file to the corresponding Document Understanding Project for data extraction.
-
Invoice_PWF_CheckRoleCondition workflow validates the role-based permission needed as part of the processing of invoice documents.
The below table summarizes the average execution time taken by the clones workflows.
|
|
|
Clones Workflow (Seconds) |
|
|
|
Invoice Batch |
Executions |
CheckRoleCondition |
Invoice PWF Installation |
PushToDUSched |
|
51 invoices |
Test1 |
8.93 |
2.46 |
9.78 |
|
Test2 |
20.11 |
2.41 |
42.75 |
|
|
Test3 |
13.51 |
2.20 |
33.44 |
|
DU STEP WISE – EXECUTION TIME
There are several steps involved in the processing of an Invoice document by Documents Understanding application. Time taken for the execution of different steps in DU as part of Invoice extraction.
|
DU Steps |
|
Execution Time (Seconds) |
|
||
|
AVG |
MIN |
MAX |
Occurrence per batch |
Extended Time per batch |
|
|
INITIALIZE |
1.82 |
0.42 |
3.86 |
155 |
281.36 |
|
VALIDATE |
0.99 |
0.16 |
2.34 |
155 |
153.89 |
|
ZIP_EXTRACT |
1.50 |
1.50 |
1.50 |
1 |
1.50 |
|
INV_DOC_SPLIT |
527.20 |
527.20 |
527.20 |
1 |
527.20 |
|
INV_PAGE_SPLIT |
3.30 |
0.73 |
6.43 |
51 |
168.25 |
|
INV_IMAGE_OCR |
20.61 |
3.74 |
50.54 |
102 |
2101.85 |
|
SMART_EXTRACT_PREPROCESSOR |
5.47 |
2.21 |
14.68 |
102 |
557.60 |
|
SMART_EXTRACT |
11.47 |
9.34 |
15.93 |
102 |
1170.06 |
|
SMART_EXTRACT_POSTPROCESSOR |
3.24 |
0.62 |
9.23 |
102 |
330.22 |
|
SMART_EXTRACT_FOI |
15.39 |
1.50 |
48.18 |
102 |
1569.59 |
|
TRIGGER_PARALLEL_VESPA_SE |
7.69 |
2.10 |
17.02 |
102 |
784.08 |
|
INV_RESULT_AGGREGATE |
0.61 |
0.23 |
1.96 |
51 |
30.95 |
|
FINALIZE |
1.82 |
0.39 |
6.57 |
359 |
654.73 |
|
PDF_SEARCH |
6.78 |
1.06 |
22.50 |
102 |
691.23 |
DU STEP WISE – QUEUE TIME
Each steps of Document extraction in DU, there is a Queue phase associated. The below table summarizes the time spent in the Queue phase of each of the DU steps.
|
DU Steps |
|
Queue Time (Seconds) |
|
||
|
AVG |
MIN |
MAX |
Occurrence per batch |
Extended Time per batch |
|
|
INITIALIZE |
3.50 |
0.74 |
12.14 |
155 |
541.93 |
|
VALIDATE |
3.56 |
0.70 |
10.68 |
155 |
552.42 |
|
ZIP_EXTRACT |
0.74 |
0.74 |
0.74 |
1 |
0.74 |
|
INV_DOC_SPLIT |
0.85 |
0.85 |
0.85 |
1 |
0.85 |
|
INV_PAGE_SPLIT |
566.24 |
107.91 |
803.88 |
51 |
28878.42 |
|
INV_IMAGE_OCR |
169.77 |
0.95 |
345.02 |
102 |
17316.99 |
|
SMART_EXTRACT_PREPROCESSOR |
181.55 |
1.05 |
290.00 |
102 |
18518.38 |
|
SMART_EXTRACT |
6.88 |
0.82 |
33.92 |
102 |
701.48 |
|
SMART_EXTRACT_POSTPROCESSOR |
76.67 |
2.69 |
143.23 |
102 |
7820.43 |
|
SMART_EXTRACT_FOI |
194.57 |
1.18 |
345.33 |
102 |
19846.32 |
|
TRIGGER_PARALLEL_VESPA_SE |
2.72 |
0.82 |
8.22 |
102 |
277.24 |
|
INV_RESULT_AGGREGATE |
1.92 |
0.71 |
5.76 |
51 |
98.02 |
|
FINALIZE |
1.94 |
0.66 |
11.21 |
359 |
697.89 |
|
PDF_SEARCH |
4.76 |
0.59 |
24.90 |
102 |
485.08 |
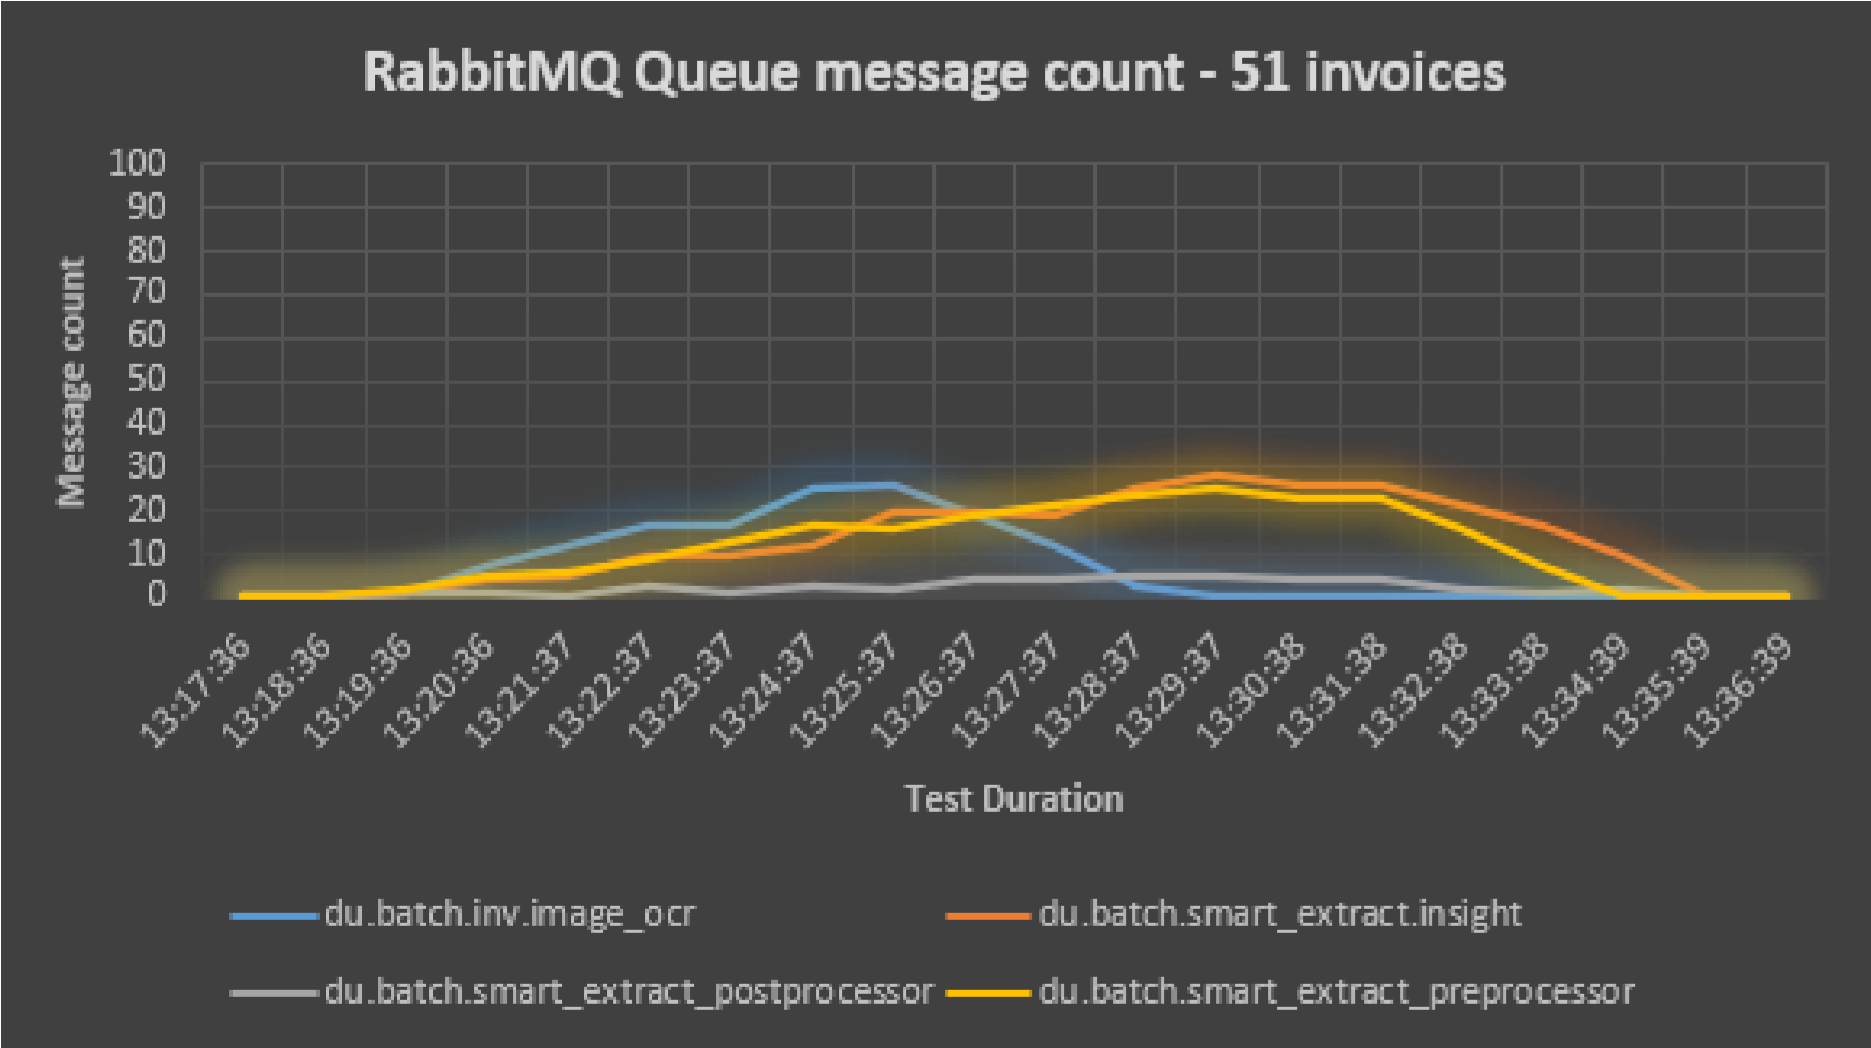
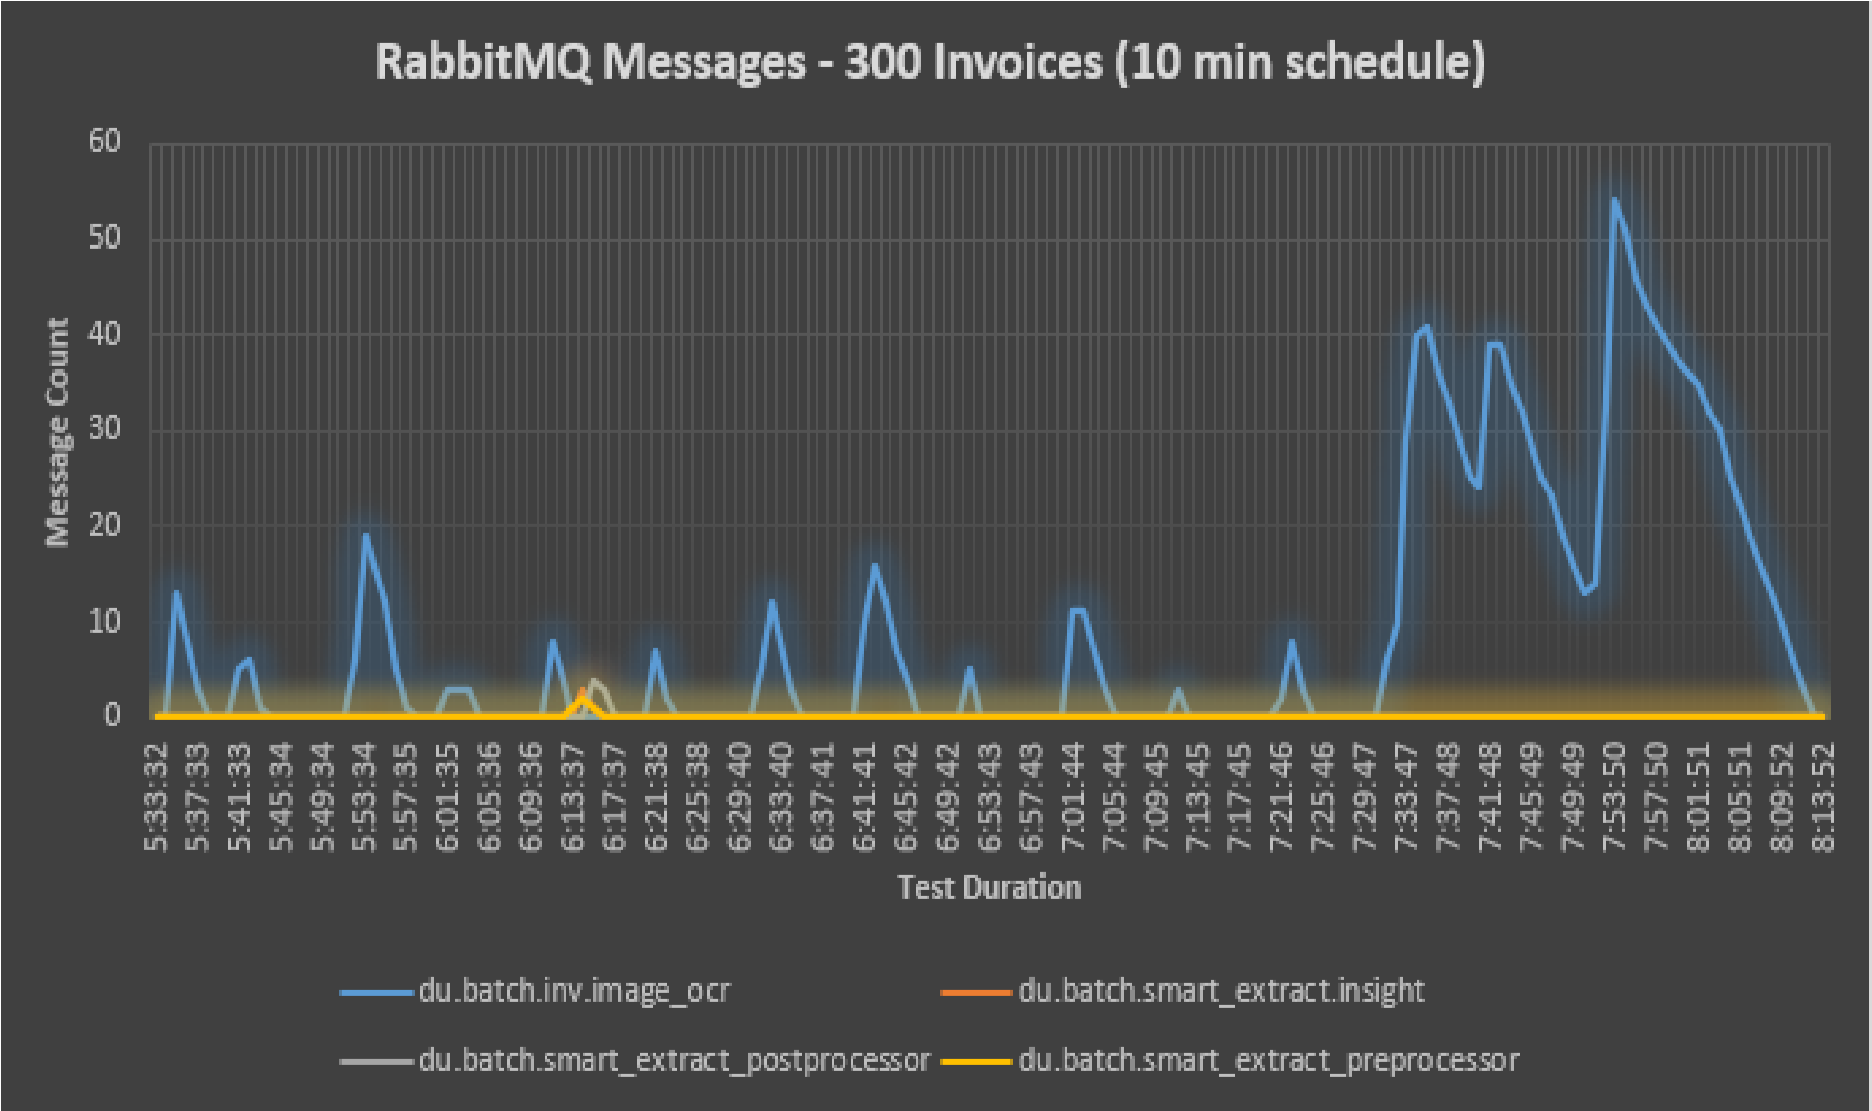
RABBITMQ MESSAGE QUEUE
A Queue phase is part of each DU steps when the number of messages reaches beyond the capacity of the individual step that can be processed. These additional messages are stored in the RabbitMQ message system.
During the test execution, this RabbitMQ Queue message metrics are captured in identifying in which Queue the de-Queuing process is slow. This will help in fine tuning of the DU component and there by improve the overall application performance.
The below graph represents the count of messages in different queue used by each DU steps during test execution.
ORG TEST
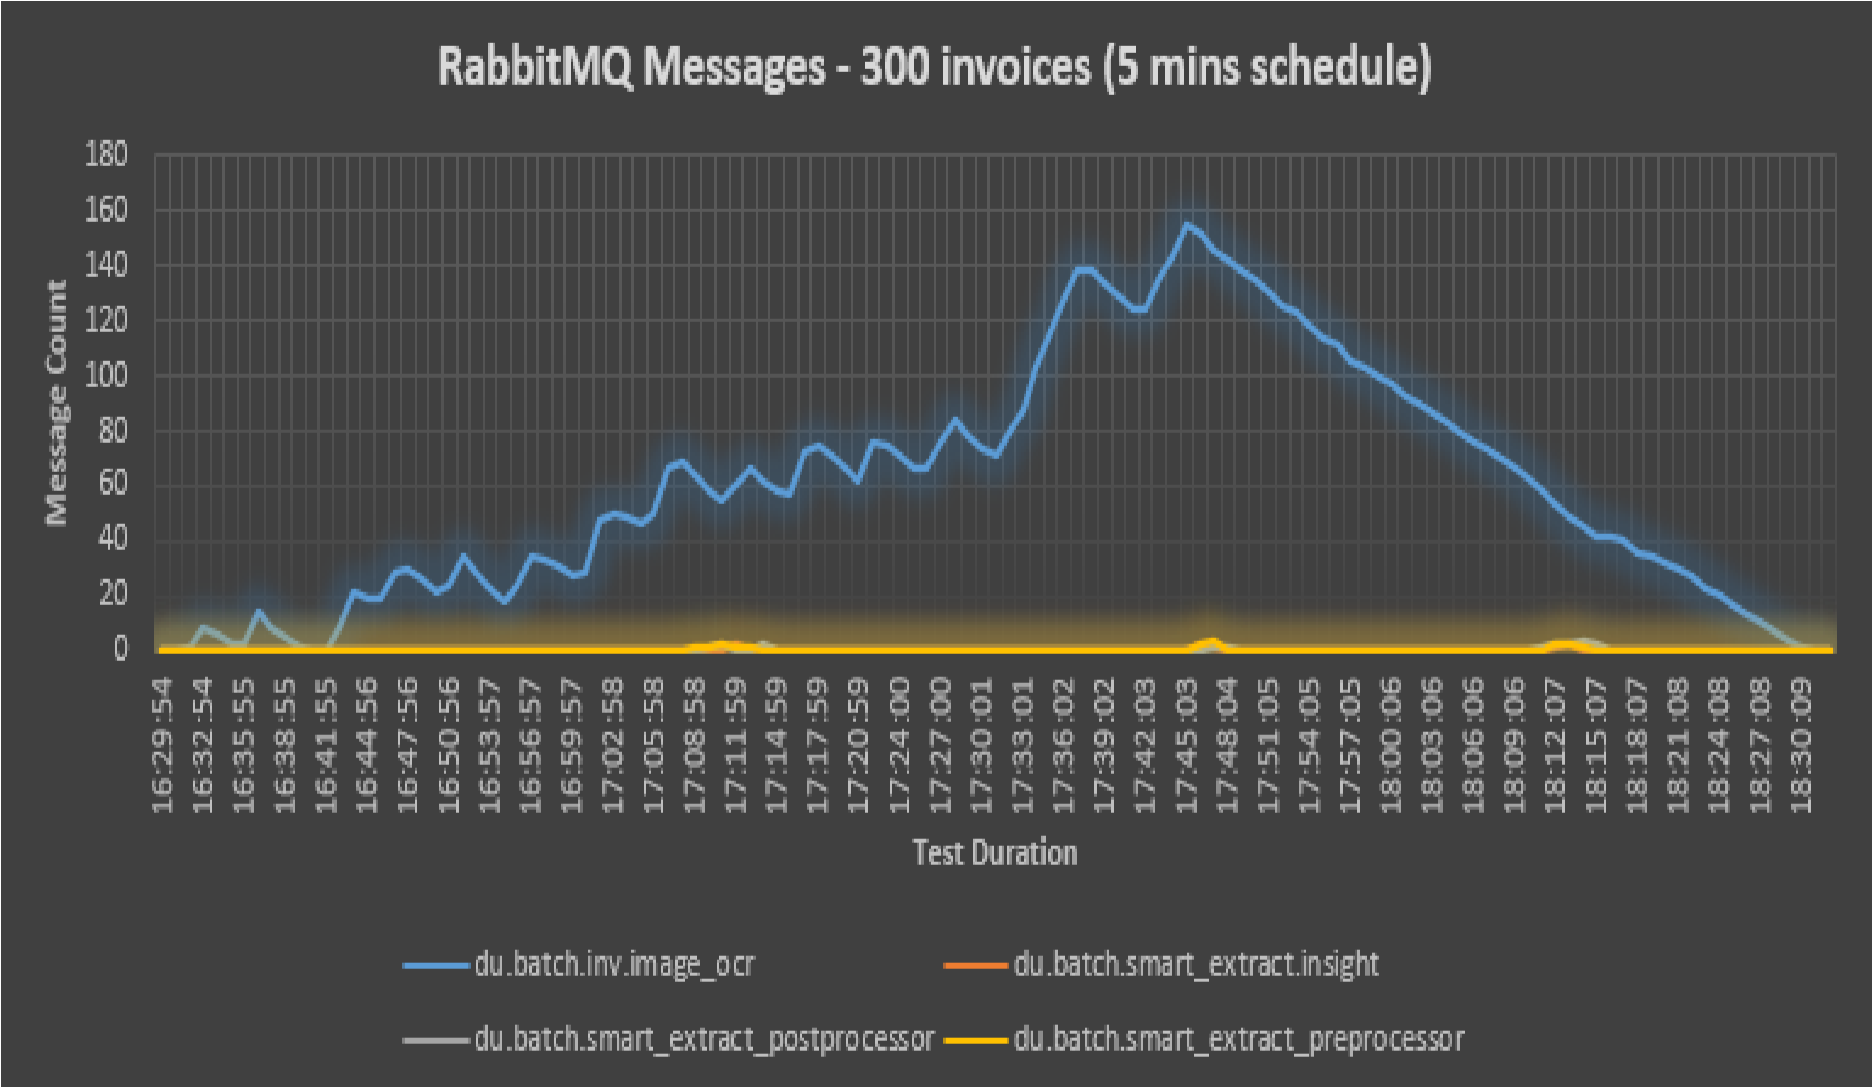
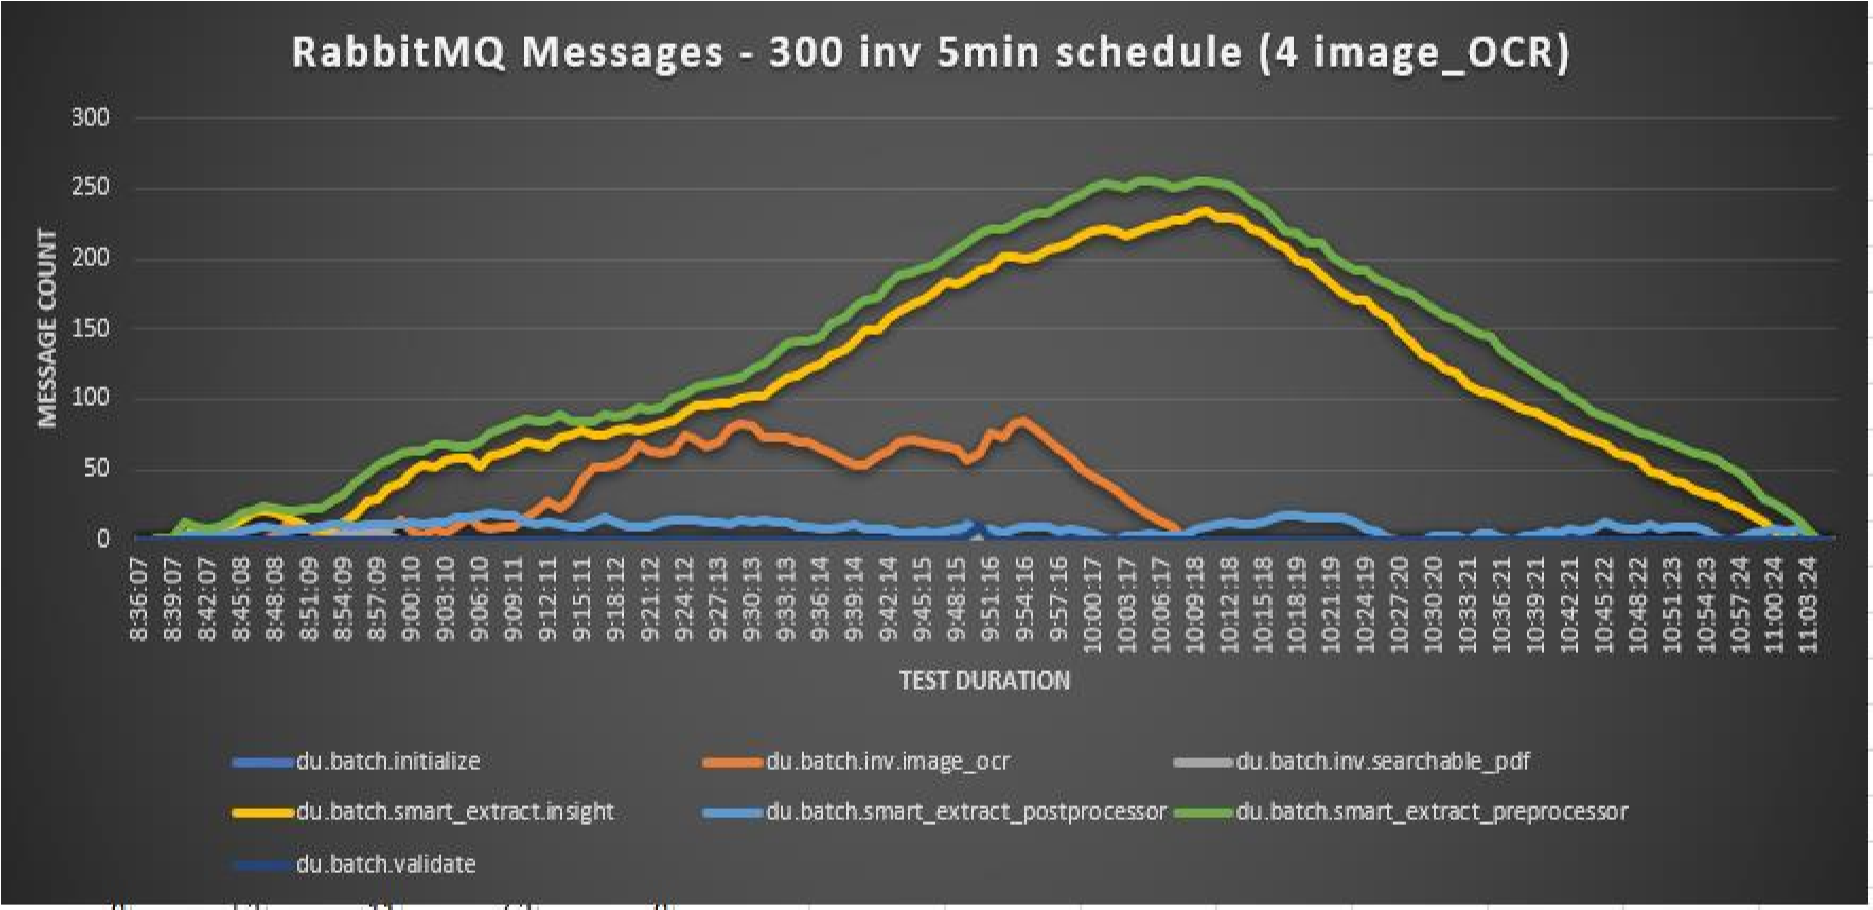
RABBITMQ MESSAGE COUNT – 4 IMAGE_OCR POD REPLICAS (5 MIN SCHEDULE)
All the tests are executed with 3 POD replicas of Smart Extract & image_OCR. Higher RabbitMQ queue messages observed for image_OCR replicas during 5 and 7 min schedule tests. We had an experimental test conducted with 4 image_OCR replicas and observed that the message queues are coming down and there by improves the performance. More such tests are planned to conduct for the SmartVision 2.4 release.
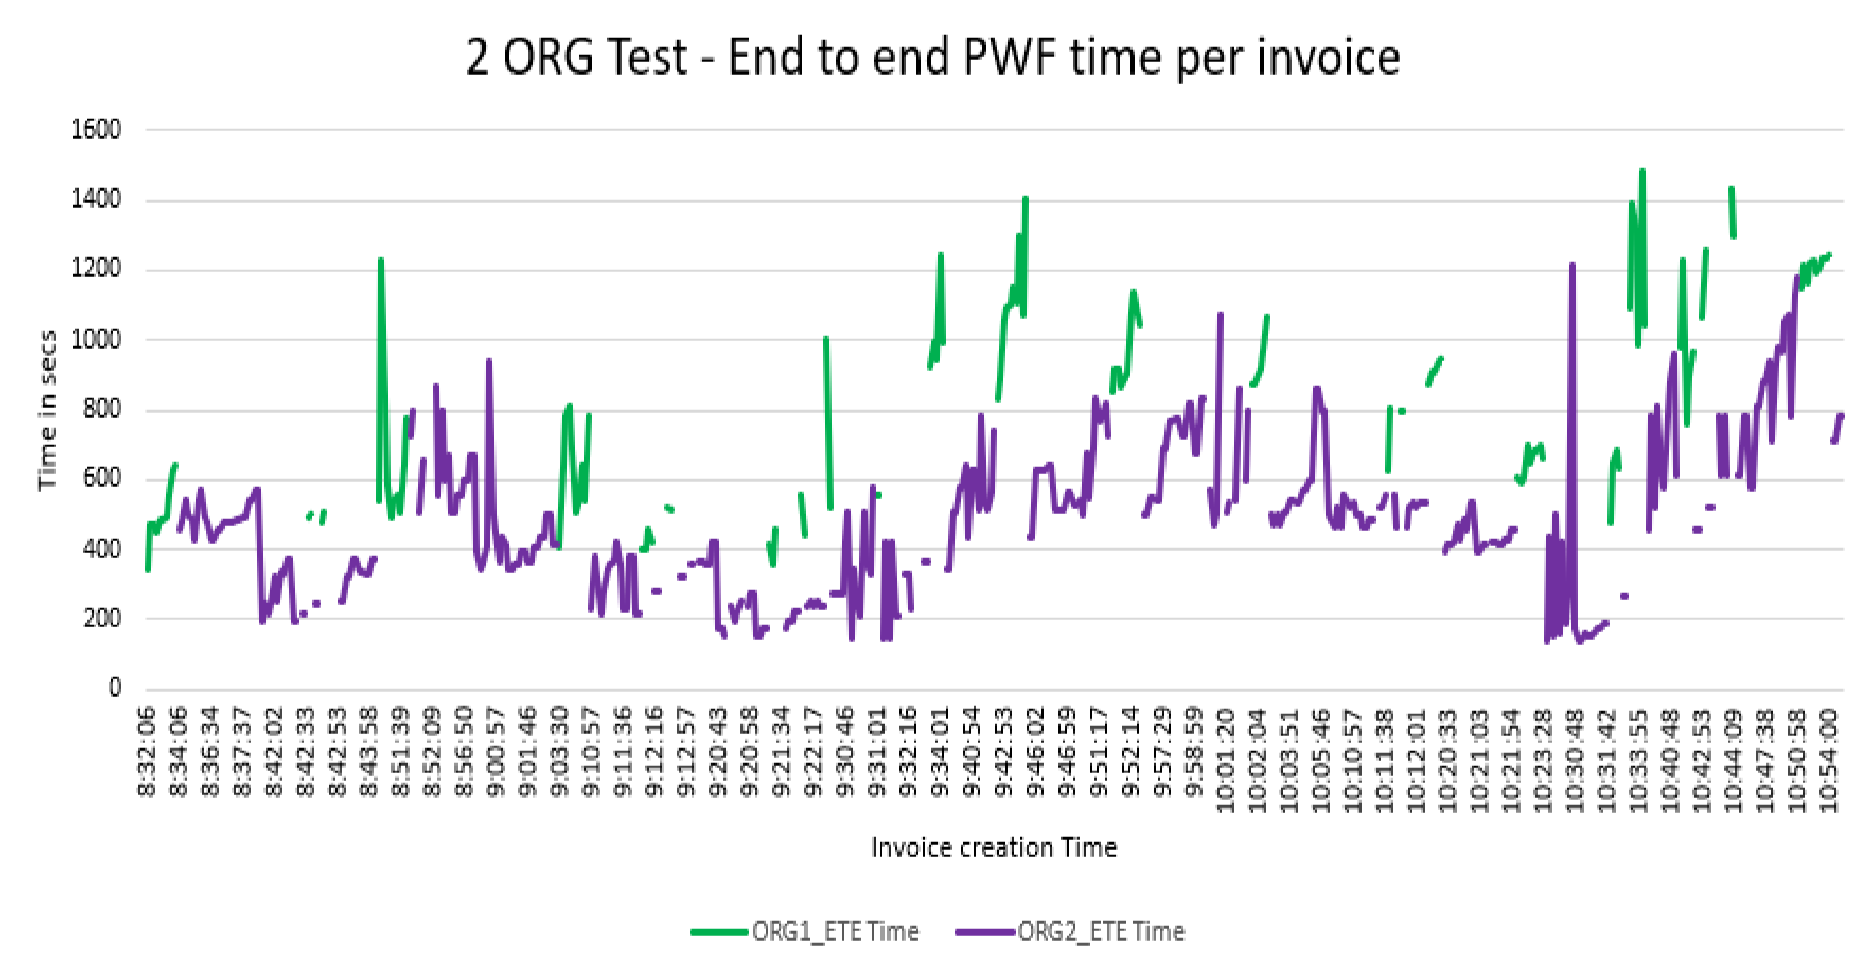
END-TO-END PWF TIME - 7 MINS SCHEDULE
END-TO-END TIME - 10 MINS SCHEDULE
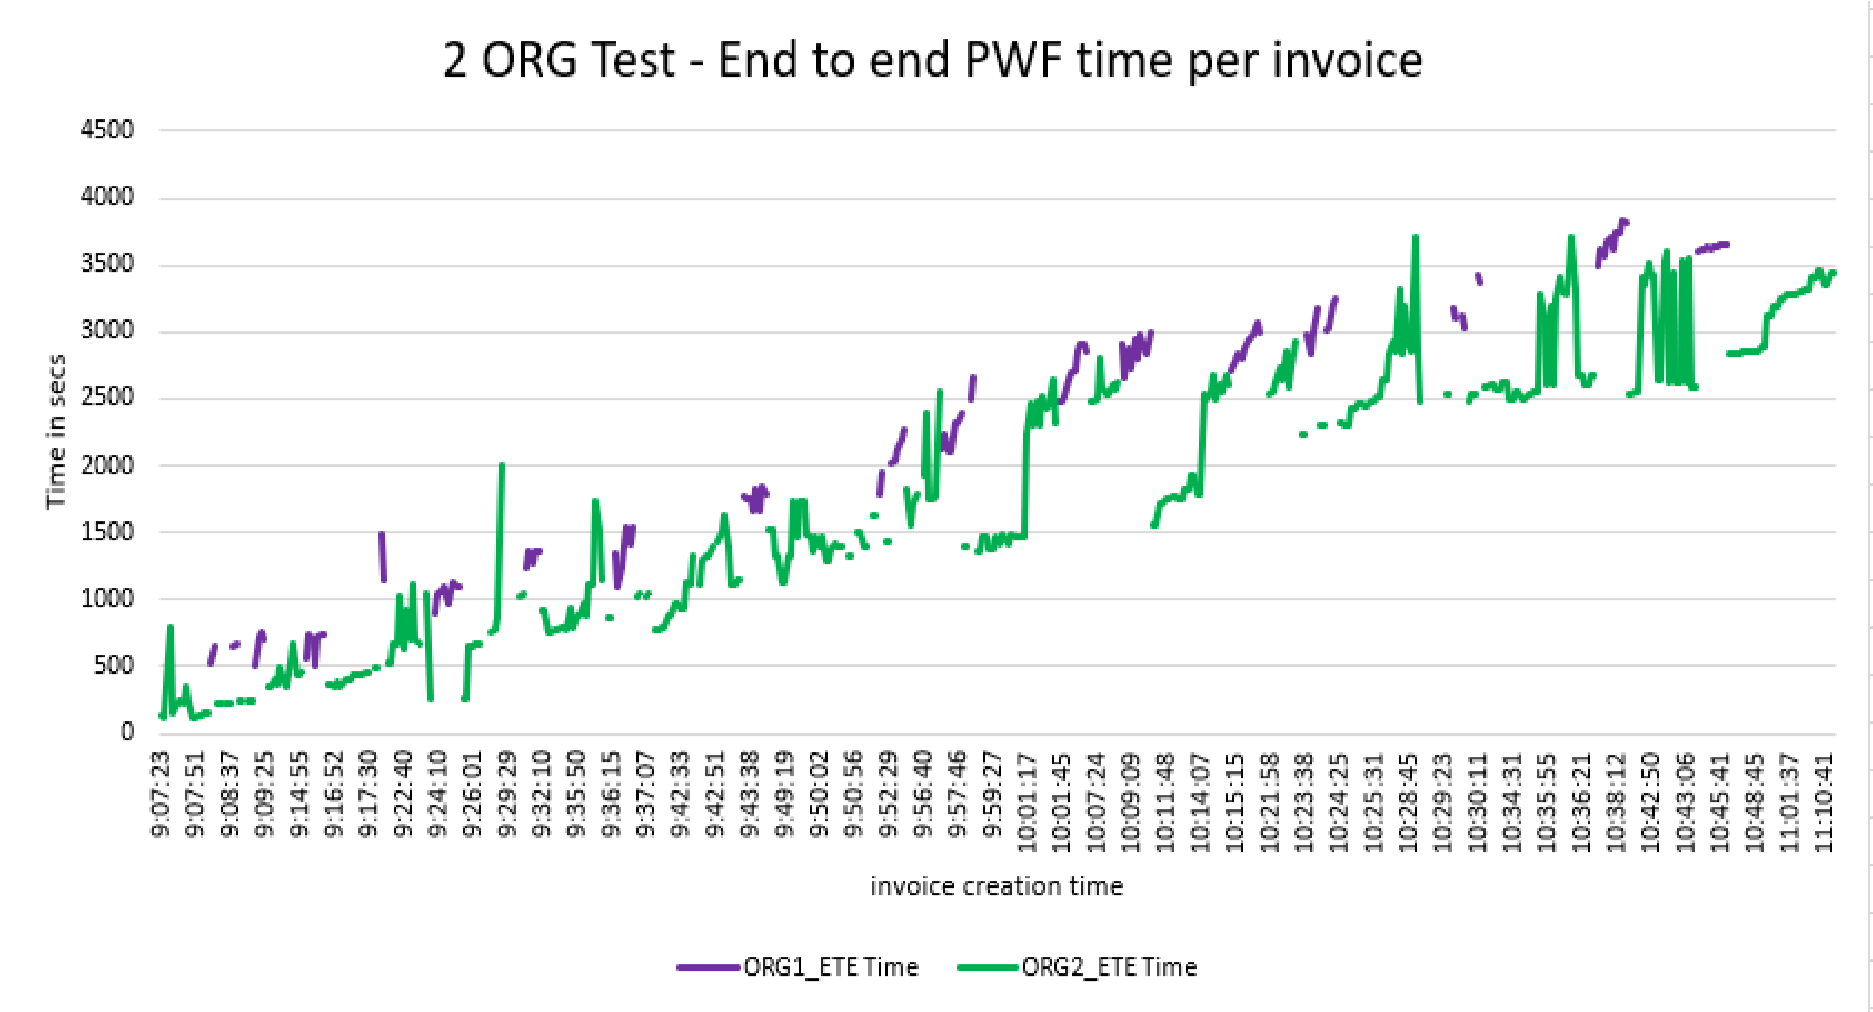
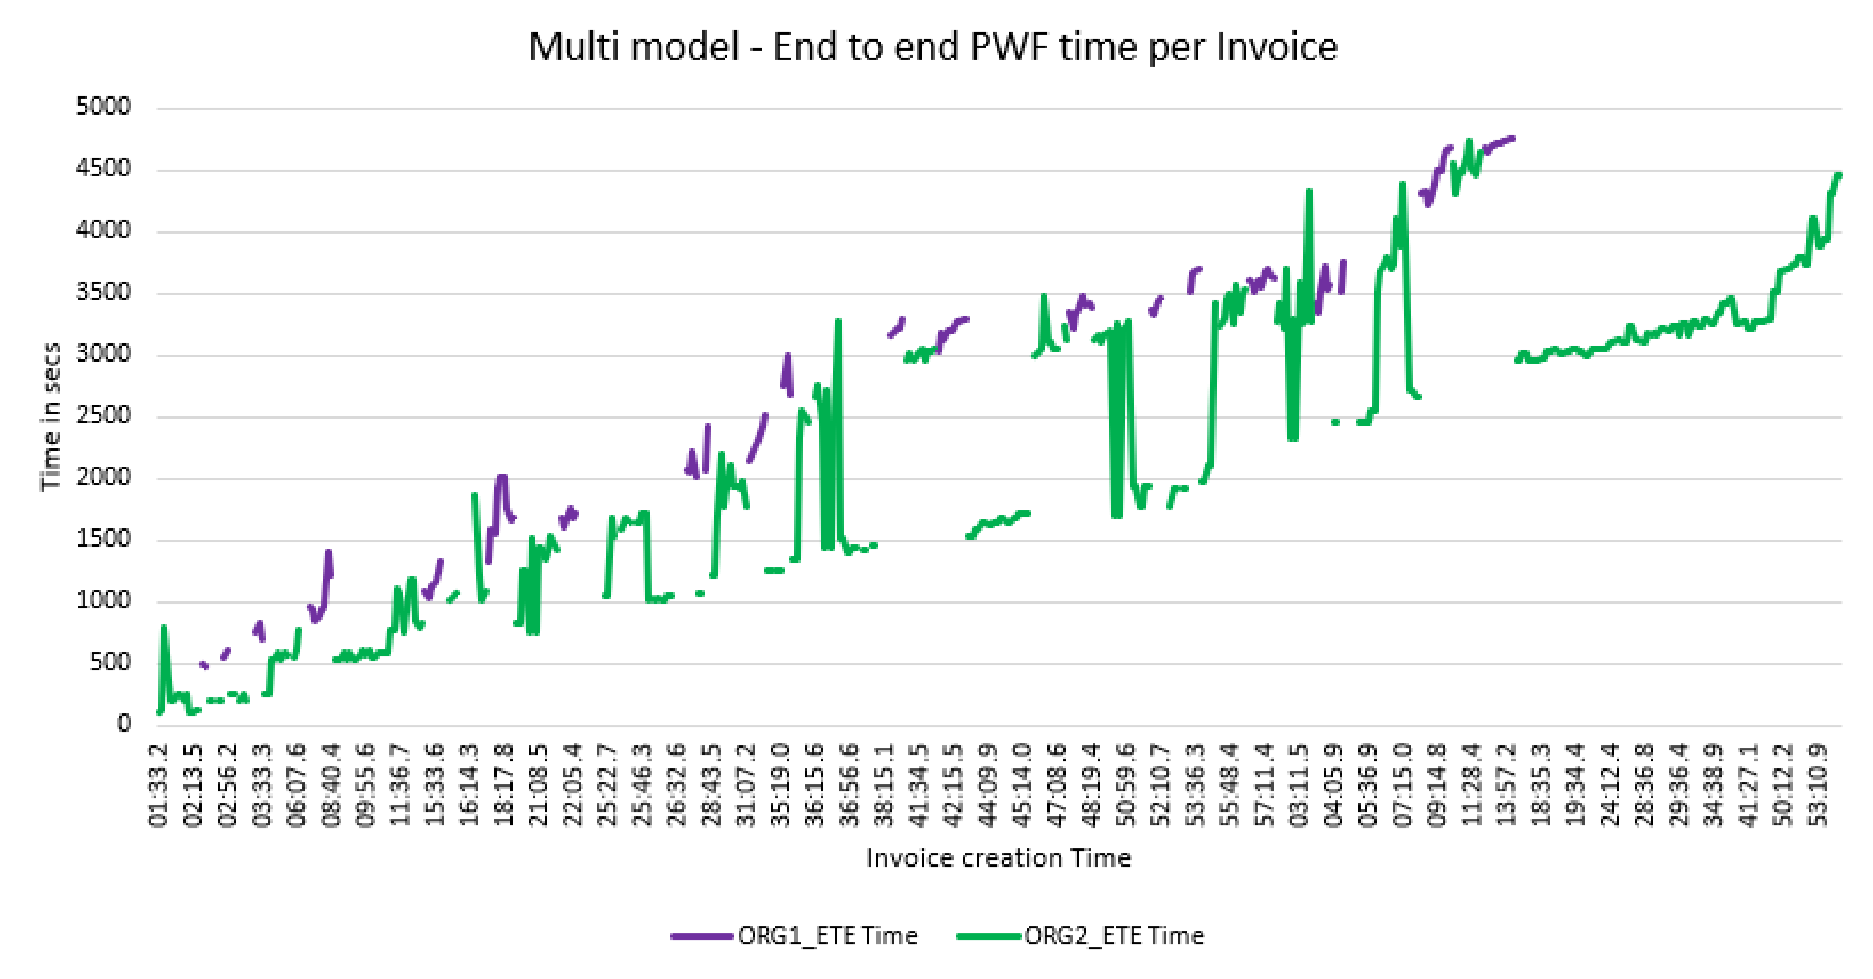
MULTI MODEL TEST
END-TO-END TIME – MULTI MODEL TEST (5 MIN SCHEDULE)
ORG1 invoice schedule: 15 batches with 10 invoices in each batch. ORG2 invoice schedule: 15 batches with 10 invoices in each batch.
UI TEST
Percentile (P90) 10 Users API execution time comparison between Local machine and VM.
|
Label |
90th Percentile API Time (P90) milli seconds |
|
|
Local Machine |
Virtual Machine (VM) |
|
|
lock/renew |
619 |
121 |
|
pages/image |
1923 |
567 |
|
action-reason-list |
503 |
50 |
|
alerts |
1156 |
94 |
|
correction/invoice_Save N Approve |
2094 |
1258 |
|
du_projects |
1352 |
164 |
|
fetch-details |
1030 |
72 |
|
fetch-projects-for-a-user |
1070 |
406 |
|
get_summary |
1829 |
1025 |
|
get_summary_PROJECTID |
1526 |
1055 |
|
getdufields |
1245 |
234 |
|
get-run |
1132 |
132 |
|
invoice-status-update_ESCALATE |
624 |
187 |
|
invoice-status-update_REJECT |
698 |
228 |
|
lock-off |
1217 |
140 |
|
lock-on |
1130 |
178 |
|
lock-renew |
1118 |
138 |
|
pages/image |
1760 |
513 |
|
pages-image_INVOICEID |
1329 |
562 |
|
pending |
1688 |
940 |
|
pwf/fetch-details |
1097 |
71 |
|
rebound-tables |
547 |
124 |
|
results_INVOICEID |
1553 |
641 |
|
run_get |
1455 |
645 |
Below table summarizes the UI time captured using a stopwatch while navigating the test scenarios from the chrome bowser during the 10 users load executed from the JMeter tool.
|
UI user action time captured using a stopwatch (seconds) |
|
|||||
|
User action from the browser |
Local machine |
API time |
VM |
API time |
||
|
PDF view - sample 1 |
3.69 |
1.48 |
1.26 |
1.2 |
||
|
PDF view - sample 2 |
3.27 |
1.92 |
1.26 |
0.948 |
||
|
PDF view - sample 3 |
2.67 |
1.95 |
1.7 |
1.19 |
||
|
PDF view - sample 4 |
2.26 |
1.5 |
1.32 |
0.936 |
||
|
PDF view - sample 5 |
1.68 |
1.48 |
1.88 |
1.48 |
||
|
next - sample 1 |
2.86 |
0.83 |
1.64 |
0.424 |
||
|
next - sample 2 |
1.32 |
0.862 |
1.37 |
0.568 |
||
|
next - sample 3 |
2.31 |
0.808 |
1.49 |
0.3 |
||
|
prev - sample 1 |
1.87 |
1.47 |
1.32 |
0.838 |
||
|
prev - sample 2 |
3.25 |
1.14 |
1.81 |
0.845 |
||
|
prev - sample 3 |
1.93 |
0.91 |
2.1 |
0.838 |
||
|
save & approve |
2.96 |
1.31 |
2.01 |
0.601 |
||
|
escalate |
2.69 |
0.495 |
1.92 |
0.404 |
||
|
Reject |
2.09 |
0.429 |
1.62 |
0.306 |
||
|
Select draw pane |
2.67 |
0.521 |
1.65 |
0.306 |
||
|
next - sample 1 |
3.08 |
0.68 |
1.63 |
0.444 |
||
|
next - sample 2 |
2.29 |
0.706 |
1.38 |
0.464 |
||
|
prev - sample 1 |
2.87 |
0.694 |
1.51 |
0.611 |
||
|
prev - sample 2 |
2.58 |
0.86 |
1.28 |
0.267 |
||
|
Select point & select |
3.25 |
1 |
1.99 |
0.206 |
||
|
6.0. |
INFRASTRUCTURE RESOURCE USAGE |
|||||
As part of ensuring high availability, 2 PODS of each components are deployed in Kubernetes. The data represented below are the maximum CPU cores & memory usage of both the PODs.
TEST EXECUTION RAW DATA
Test execution raw data is available on the following SharePoint location - Test Run Data