ITOps v1.3-Performance Test Report
Contents
- Overview
- Performance Testing – Workload Parameters
- Test Environment - Infrastructure setup
- Performance Testing - Software Used
- Performance Testing – ITOps components & Replicas
- Performance Test Approach
- Performance Test -Summary
- Performance Metrics Captured
- Clones Workflow Execution Time
- Performance Test – Infrastructure Resource Usage
- Performance test Observations & Recommendations
- Performance test metrics comparison- ITOps 1.3 & 7.1.2
- Infrastructure Cost
- Performance test Execution results
Overview
SmartOps ITOps manages alerts and notifications from multiple monitoring agents for an organization.
It supports automatic creation of Service Now tickets against alerts and provides intelligent root-cause suggestions by correlating with existing open tickets.
It avoids creation of duplicate tickets by identifying similar open tickets or root tickets based on the dependency topology.
Performance Testing – Workload Parameters
The following parameter define the workload for executing the performance testing of ITOps for Queue channel during multiple test executions.
|
Total sample Alerts |
21090, 21250 |
|
Test Duration |
23 hrs, 25 hrs |
|
Monitoring Agent type |
SolarWinds |
|
Type of Alerts |
UP, DOWN, WARNING, CRITICAL, NOTIFICATIONS |
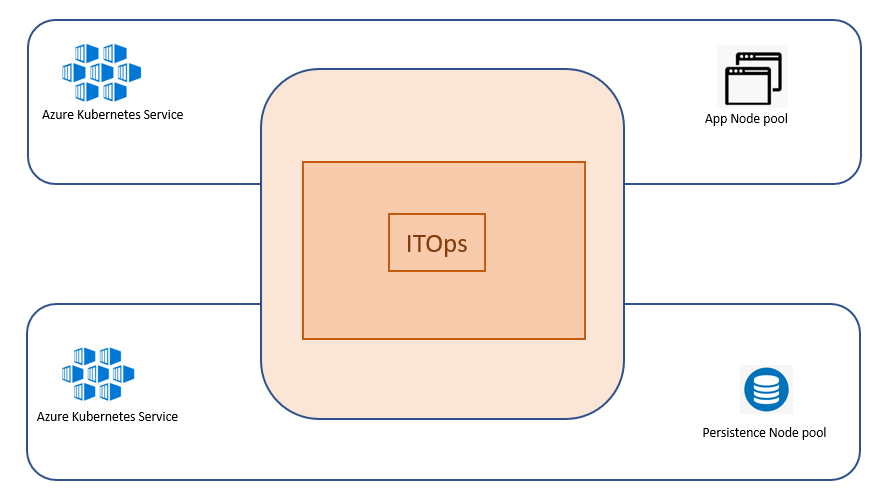
Test Environment - Infrastructure setup
ITOps components, IHub, Clones, Databases & Message Broker are hosted in Kubernetes environment in Azure cloud.
Performance Testing is conducted with the following configuration of Kubernetes Cluster hosted in Azure. The Kubernetes ITOps cluster comprises of 2 different types of node pools such as Application Node Pool, Persistent Node Pool.
The below table summarizes the hardware configuration & Number of VM & components hosted in each Node Pools.
|
Kubernetes Nodes |
Hardware Infrastructure |
Node Count |
||
|
Min |
Max |
|||
|
Application Node Pool Components Smartops-pwf, ihub-component, ihub-services, itopsui, clones, clones-sense, clones-sense-queue, alertmapping, correlation, smartops-keycloak |
Azure D8sv3 CPU - 8 vCPU Core RAM: 32 GB |
3 |
6 |
|
|
Persistent Pool Components MongoDB, RabbitMQ, Elastic Search, Kibana |
Azure D4sv3 CPU - 4 vCPU Core RAM: 16 GB |
3 |
5 |
|
|
MySQL |
Azure Managed MYSQL General Purpose, 2 Core(s), 8GB RAM Storage: 100 GB (Auto Grow Enabled) |
NA |
NA |
|
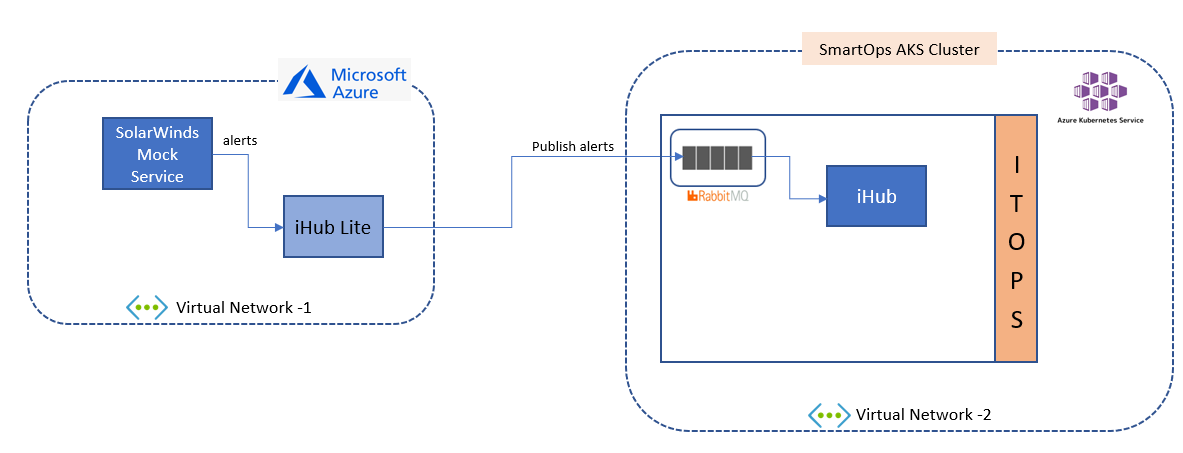
Performance test environment setup
To replicate a production-based Infrastructure environment IHub Lite & SolarWinds based mock service are hosted in an Azure VM hosted at Azure cloud in a different virtual network.
IHub main along with ITOps components are hosted at Kubernetes environment in Azure cloud in another virtual network.
Performance Testing - Software Used
Following Tools used as part of performance testing
|
Tool |
Version |
Description |
|
JMeter |
5.1.1 |
Implementing Performance testing |
|
Prometheus |
|
Capture resource utilization on server side |
|
Grafana |
|
Dashboard to view resource utilization |
|
Microsoft Excel |
|
Analysing test results &reports |
|
ITOps |
1.3 |
|
Performance Testing – ITOps components & Replicas
The below table provides details of docker containers of different components associated with ITOps from, Clones, ITOps, Clones, iHub, Database & Message Broker.
This also provides detail of components identified for Autoscaling and the criteria defined for Autoscaling. As part of ensuring availability of non-scalable components to avoid failures of any components during document processing, 2 instances of each components are by default available in the Kubernetes cluster.
|
Stack Name |
Container Name |
Autoscaling Enabled |
Auto Scaling Criteria |
|
Clones |
clones-sense-queue |
N |
|
|
clones-engine |
Y |
Based on CPU Usage |
|
|
ITOps PWF, IHub |
Ihub-component |
N |
|
|
Ihub-services |
N |
|
|
|
correlation |
Y |
Based on CPU Usage |
|
|
alertmapping |
Y |
Based on CPU Usage |
Following are the details of replicas configured for Database & Message Broker in Kubernetes cluster MySQL is deployed as a Managed service at Azure.
|
Stack Name |
Container Name |
No of Replicas |
|
Database |
mongo |
3 |
|
elasticsearch |
3 |
|
|
mysql |
Azure Managed Service |
|
|
Message Broker |
rabbitmq |
3 |
Autoscaling Configurations
Following are the CPU threshold limits, Replicas (Minimum & Maximum) configured for each component identified for Autoscaling in Kubernetes cluster for ITOps.
|
Container name |
CPU Threshold |
min replicas |
max replicas |
|
clones-engine |
80% |
2 |
4 |
|
itops-correlation |
80% |
2 |
4 |
|
itops-alertmapping |
80% |
2 |
4 |
Performance Test Approach
Performance Testing of ITOps is conducted by sending system alerts & notifications captured by SolarWinds monitoring agent. A SolarWinds monitoring agent based mock service is created to simulate different types of System alerts such as UP, DOWN, Warning, Critical alerts & notifications alerts are simulated by the mock service.
This service is polled continuously by IHub Lite API scanner channel in a fixed interval and the polled data is pushed to ITOps Queue system from which the alerts are processed further by IHub main & ITOps. SolarWinds based mock service simulates alerts archived from a production-based system.
Test is conducted by simulating different counts of system alerts by mock service in a specific interval at different alert times. This helps in creating system alerts workload like a production-based environment
This test helps us to identify the throughput of alerts that is successfully processed by ITOps and the time taken in correlation of alerts based on the improvements introduced by platform team in this release to reduce the alert correlation time compared with previous version of ITOps.
Performance Test -Summary
Performance Testing was conducted on ITOps by sending SolarWinds based alerts samples continuously for a long duration which is simulated by SolarWinds mock service.
Multiple long duration test execution has been conducted with different counts of alerts simulated every minute by SolarWinds mock service like a production-based environment. The metrics captured & Observations/findings from the test execution helps in identifying the improvements needed in alert processing by different ITOps components.
IHub lite API scanner channel polls the mock service continuously in an interval of 1 minute and IHub lite channel publishes the alerts to ITOps Queue from which further processing of alerts starts.
In order to handle the increased workload of alerts Autoscaling is enabled for clones engine, itops correlation & alert mapping containers. Autoscaling is enabled based on the CPU usage threshold of 80% with maximum replicas of 4.
This test report is prepared based on the metrics collected from the last two long duration test execution conducted using test data archived from a production system.
Following are the counts of alerts received at IHub Lite, IHub Queue channel & Alert store. There was no missing of alerts observed in the test execution.
|
Test Execution |
Total Alerts received at iHub Lite API scanner |
Total Alerts received at iHub Queue Channel |
Total Alert received in Alert Store |
|
Test 1 |
21090 |
21090 |
21090 |
|
Test 2 |
21250 |
21250 |
21250 |
Alert Correlation Time
In order To replicate the alert simulation pattern in a production system, The test is conducted by simulating different counts of alerts from SolarWinds mock service every minute, this type of varying alert simulation pattern ensures that each time the SolarWinds mock service is polled, the count of alerts received will be different which is similar to a production system. This also helps to capture the metrics on alert correlation with varying count of alerts reaching ITOps.
Following are the threshold count of alerts set for correlation workflow, median count of alerts received per minute from SolarWinds mock service and the duration of the schedulers for Correlation, Ticket status Update & Auto closure flap cluster.
Alert Threshold count per execution of workflow represents the count of alerts taken by correlation workflow during each execution of the workflow as part of alert correlation.
|
Test Execution |
Alert Threshold Count per execution of correlation workflow |
Median count of Alerts received per minute |
Workflow Scheduler Interval (Minutes) |
||
|
Correlation |
Ticket Status Update |
Auto Close flap cluster |
|||
|
Test 1 |
55 |
40 |
3 |
5 |
5 |
|
Test 2 |
55 |
10 |
3 |
5 |
5 |
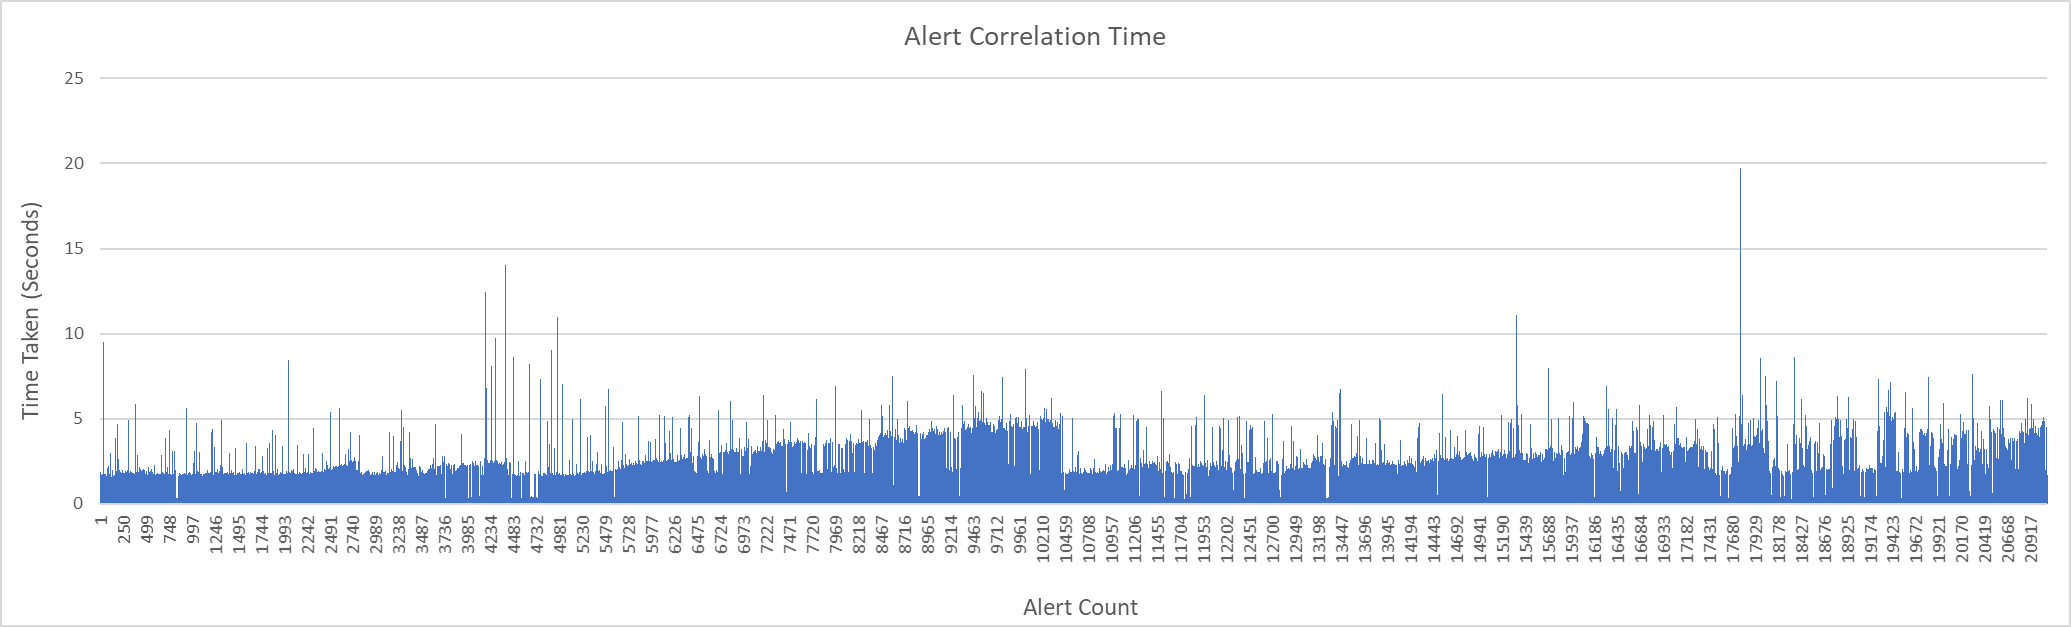
Following are the time taken for alert correlation during the 2 test executions conducted with above mentioned configuration of the count of alerts and workflow scheduler time.
Test 1
Time taken for correlation of each alerts is 3.38 seconds (p90) and median time is 1.76 seconds
|
Correlation time per alerts (seconds) |
|||||
|
Count of Alerts |
1 to 5000 |
1 to 10000 |
1 to 15000 |
1 to 20000 |
1 to 21090 |
|
90 Percentile |
2.09 |
3.34 |
3.03 |
3.31 |
3.38 |
|
Median |
1.66 |
1.71 |
1.73 |
1.76 |
1.76 |
|
Average |
1.53 |
1.83 |
1.83 |
1.9 |
1.92 |
|
Maximum |
14.05 |
14.05 |
14.05 |
19.71 |
19.71 |
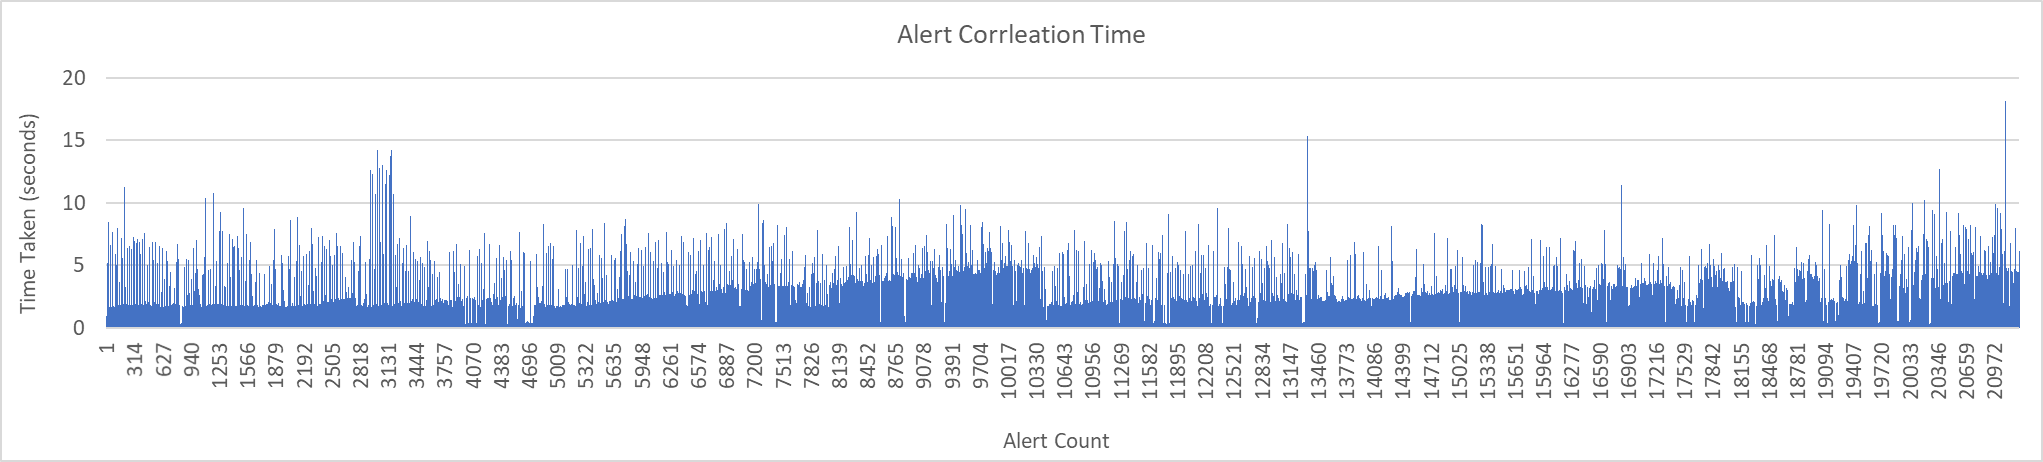
Test 2
Time taken for correlation of each alerts is 3.73 seconds (p90) and median time is 1.78 seconds
|
Correlation time per alerts (seconds) |
|||||
|
Count of Alerts |
1 to 5000 |
1 to 10000 |
1 to 15000 |
1 to 20000 |
1 to 21250 |
|
90 Percentile |
2.23 |
3.69 |
3.5 |
3.61 |
3.73 |
|
Median |
1.68 |
1.73 |
1.75 |
1.78 |
1.78 |
|
Average |
1.7 |
1.98 |
1.96 |
2.02 |
2.05 |
|
Maximum |
14.23 |
14.23 |
15.39 |
15.39 |
18.16 |
Following is the graphical representaion of time taken for correation of each alerts.
Test 1
Test 2
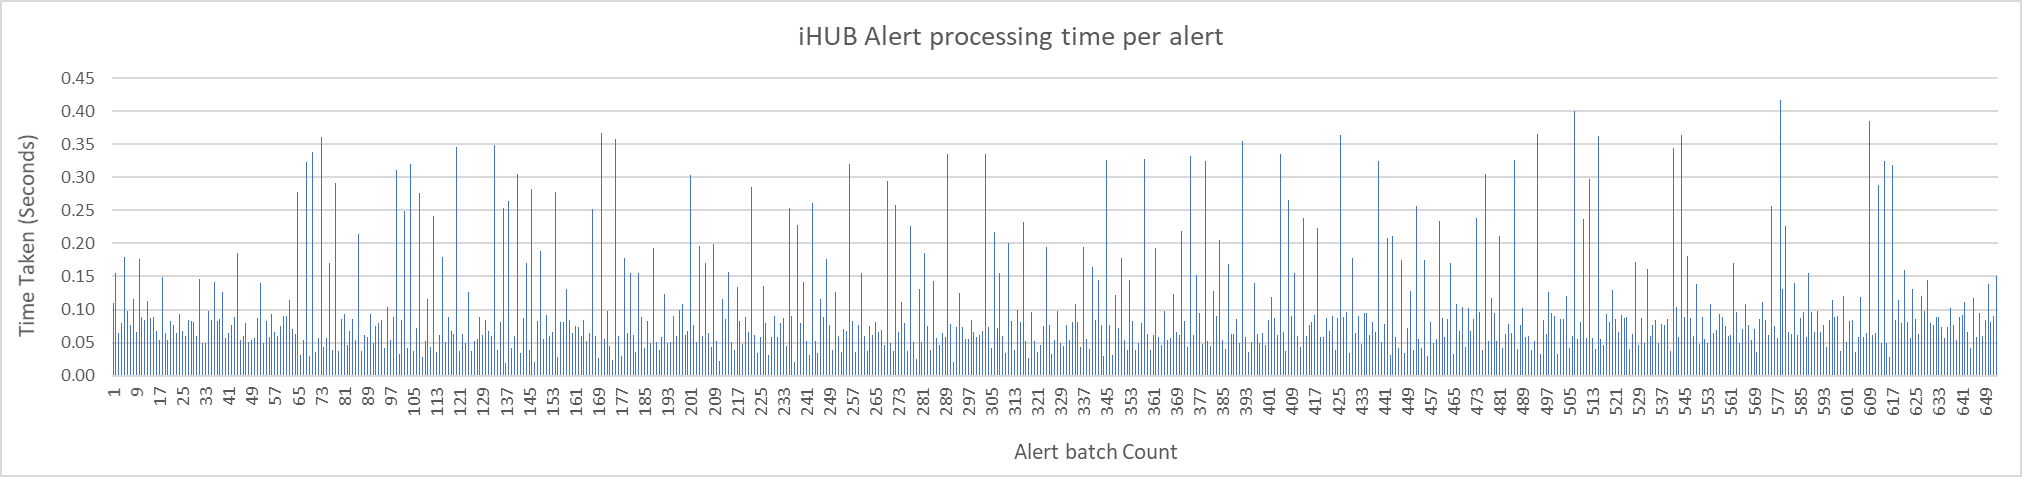
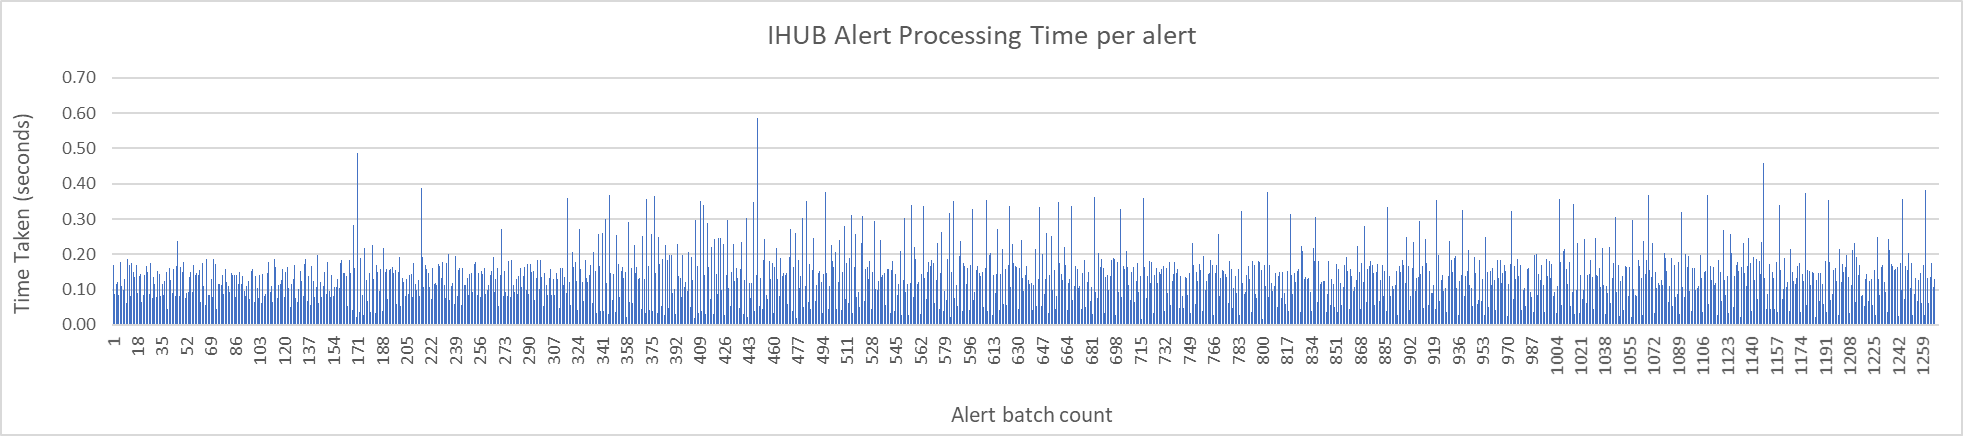
IHub Alert Processing Time
The following graph shows the time taken in the processing of alerts in IHub Queue channel. This also involves the time taken in the transformation of alerts received from IHub Lite channel to SmartOps Platform message format.
Alerts are received as batches each time when iHub polls the ITOps Queue with each batch having different counts of alerts simulated from SolarWinds mock service.
Median time taken by iHub in processing each alert received in different batch is 0.08 seconds
Test 1
Test 2
Median time taken by iHub in processing each alert received in different batch is 0.14 seconds
Performance Metrics Captured
Volume & type of Alerts sent
This captures total count of alert samples and count of major type of types of system alerts & notifications received at IHub Queue channel.
|
Test Execution |
Total Alert samples |
Up |
Down |
Critical |
Warning |
|
Test 1 |
21090 |
8714 |
4635 |
3234 |
3684 |
|
Test 2 |
21250 |
8775 |
4662 |
3255 |
3730 |
Clones Workflow Execution Time
This captures the time taken (Queue & Execution time) for the execution of workflows such as Correlation, Ticket update Scheduler & Auto close flap cluster by clones engine as part of processing different system alerts.
Each workflow has different steps of micro actions and there is a Queue phase & Execution phase involved in each of steps.
Below table summarizes the Average time taken in Queue & Execution phase involved in each step associated with a workflow during the test execution.
|
Test Execution |
Correlation Workflow |
|||||
|
|
Execution Time (Seconds) |
Queue Time (Seconds) |
||||
|
Avg |
Min |
Max |
Avg |
Min |
Max |
|
|
Test 1 |
1.51 |
0.97 |
16.60 |
2.53 |
0.35 |
742.62 |
|
Test 2 |
1.52 |
0.99 |
4.10 |
0.57 |
0.32 |
0.93 |
|
Test Execution |
Ticket Update Scheduler |
|||||
|
Execution Time (Seconds) |
Queue Time (Seconds) |
|||||
|
Avg |
Min |
Max |
Avg |
Min |
Max |
|
|
Test 1 |
14.60 |
2.82 |
34.33 |
8.0 |
0.34 |
743.14 |
|
Test 2 |
17.41 |
12.46 |
36.90 |
0.62 |
0.38 |
4.33 |
|
Test Execution |
Auto close Flap Cluster |
|||||
|
Execution Time (Seconds) |
Queue Time (Seconds) |
|||||
|
Avg |
Min |
Max |
Avg |
Min |
Max |
|
|
Test 1 |
5.42 |
2.53 |
41.87 |
5.88 |
0.36 |
743.18 |
|
Test 2 |
5.95 |
2.64 |
25.81 |
0.61 |
0.37 |
1.03 |
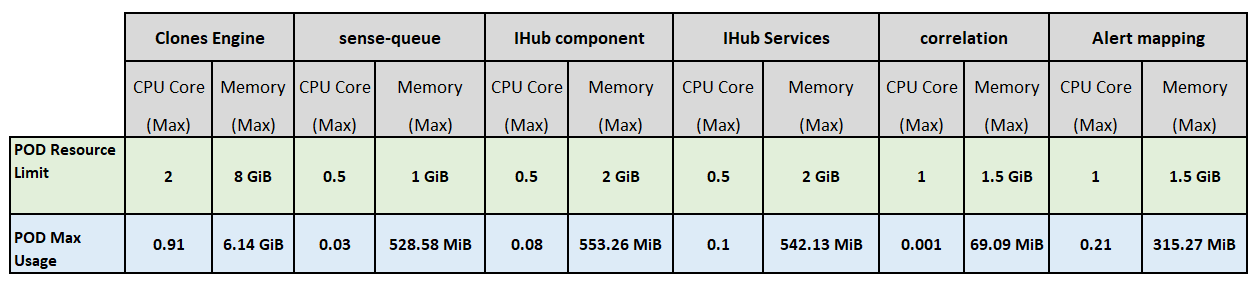
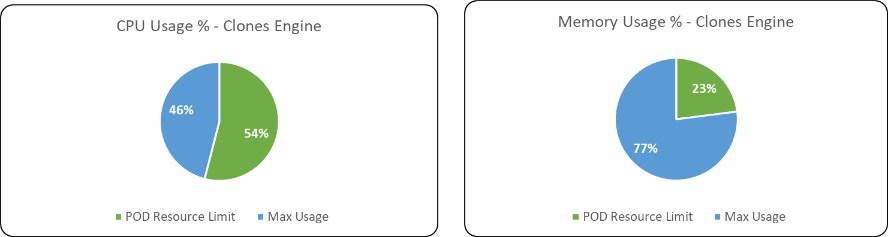
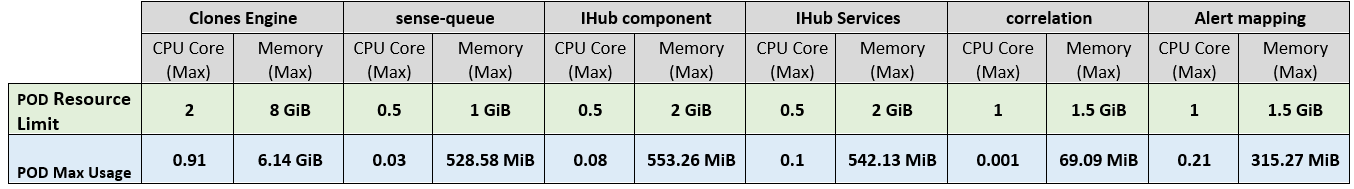
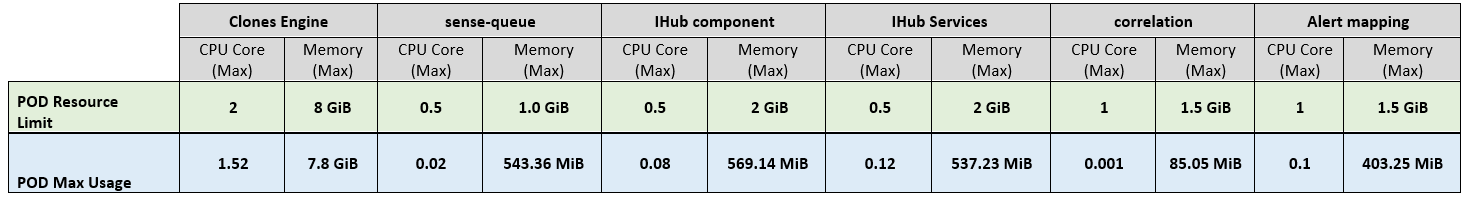
Performance Test – Infrastructure Resource Usage
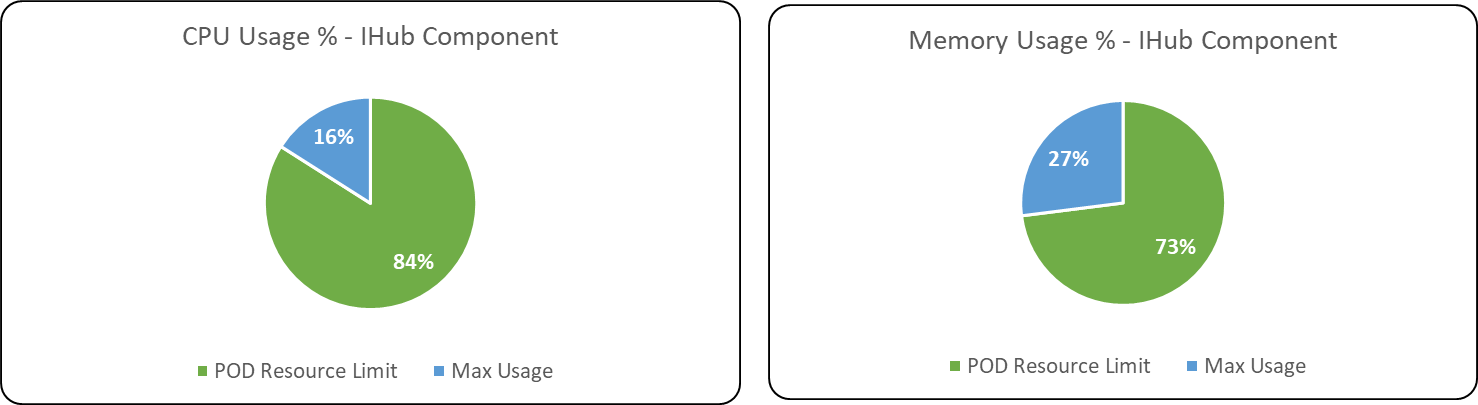
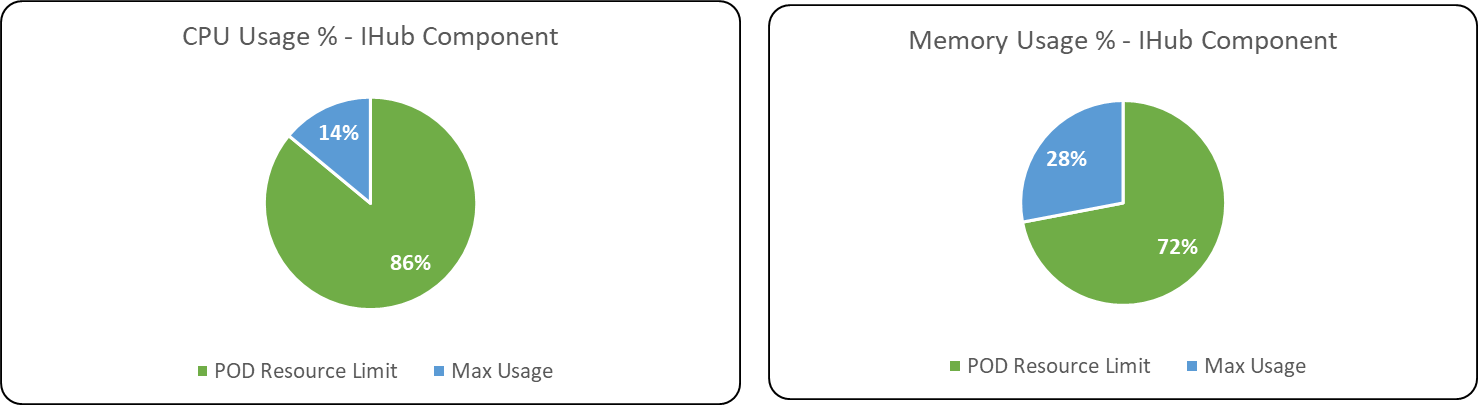
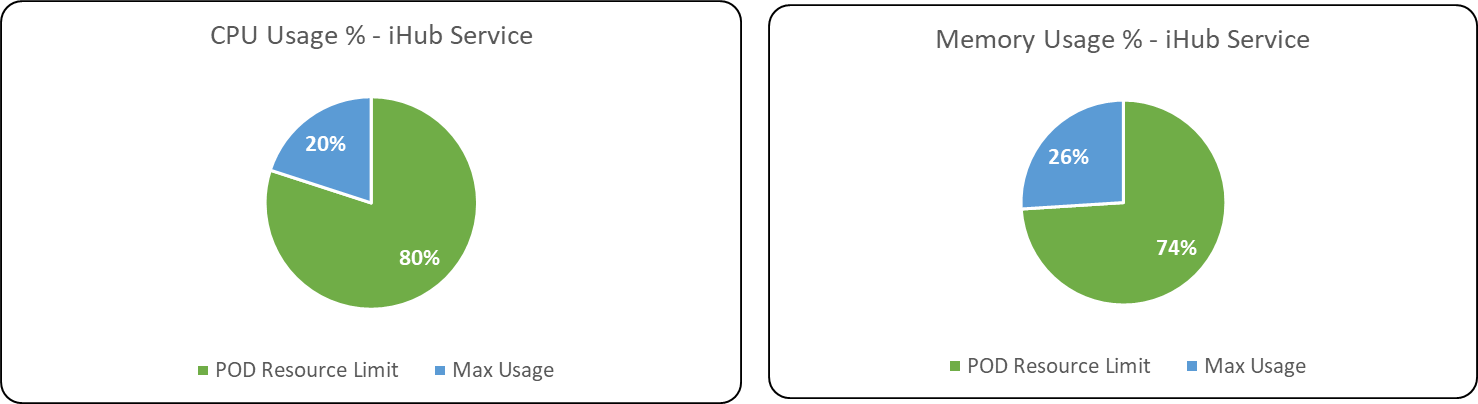
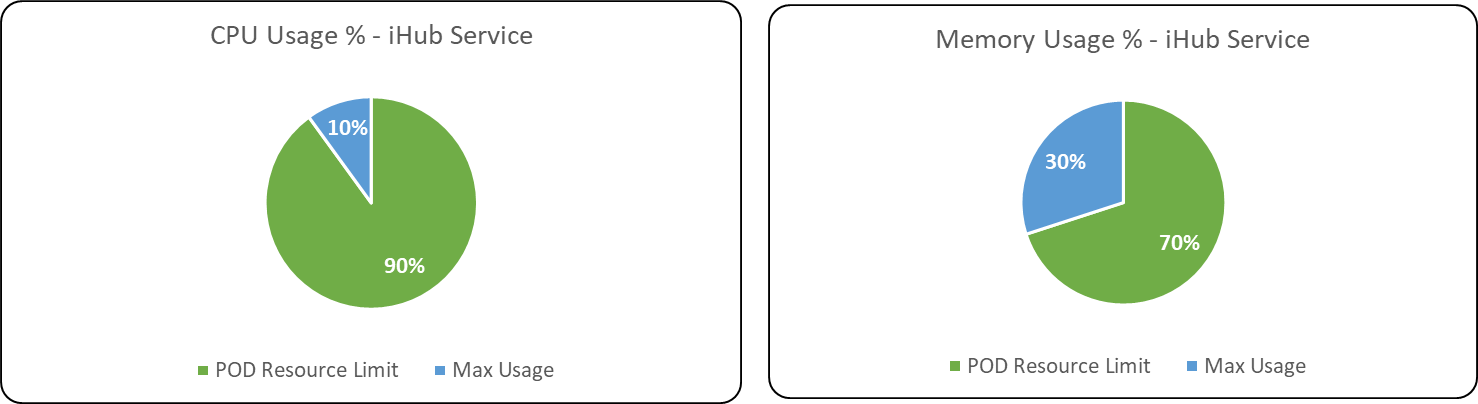
Following are the CPU & Memory usage of various components in ITOps during the test executions.
Application components
Test 1
Test 2
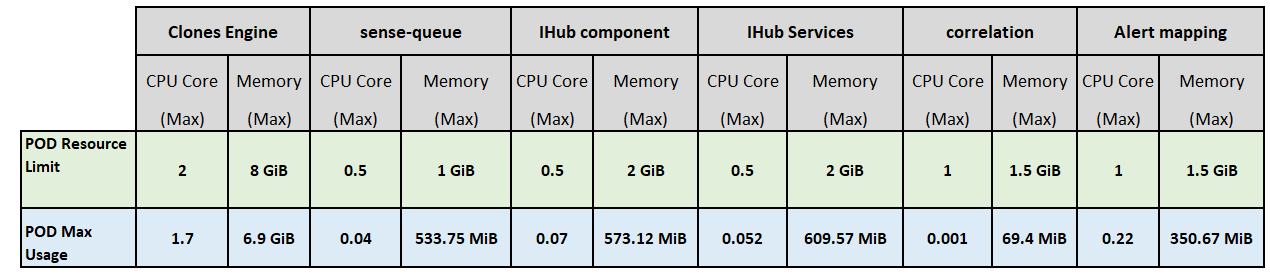
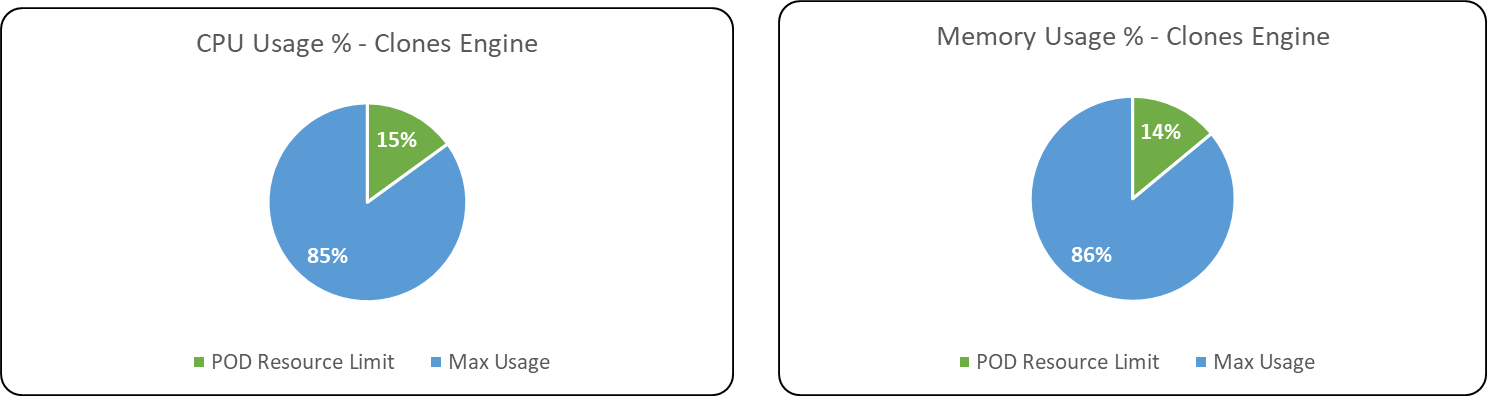
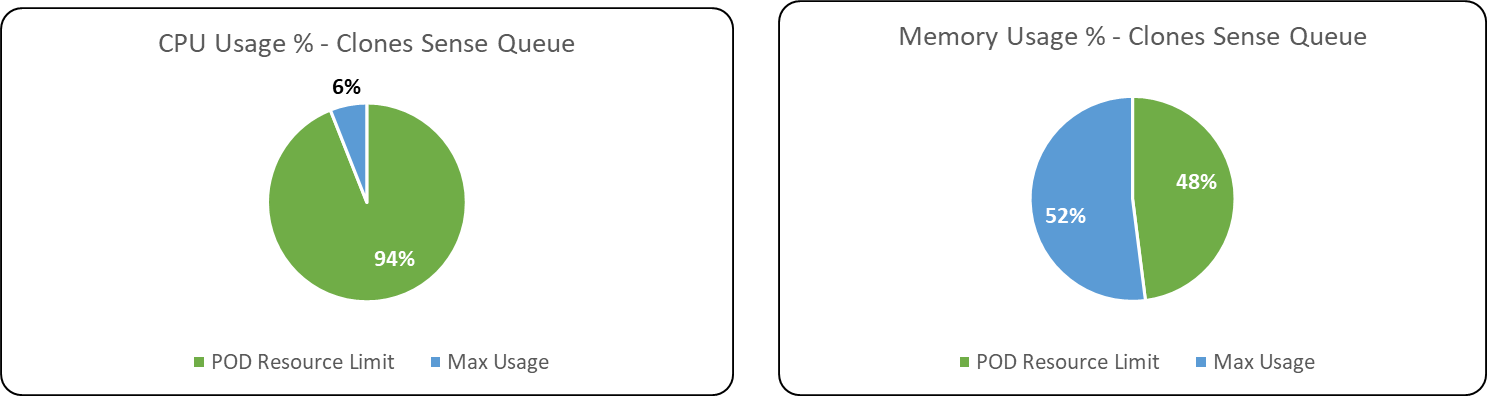
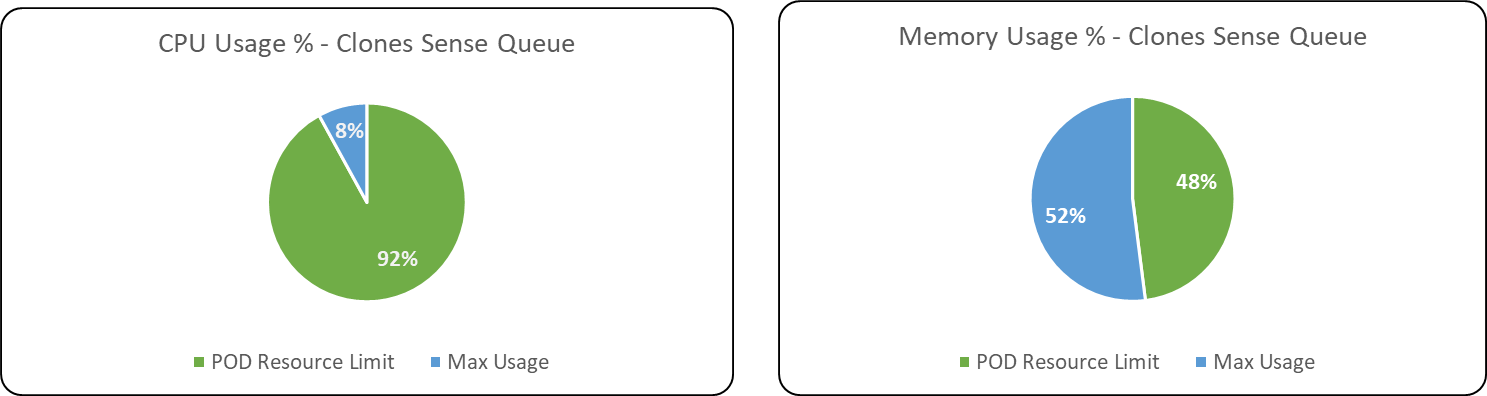
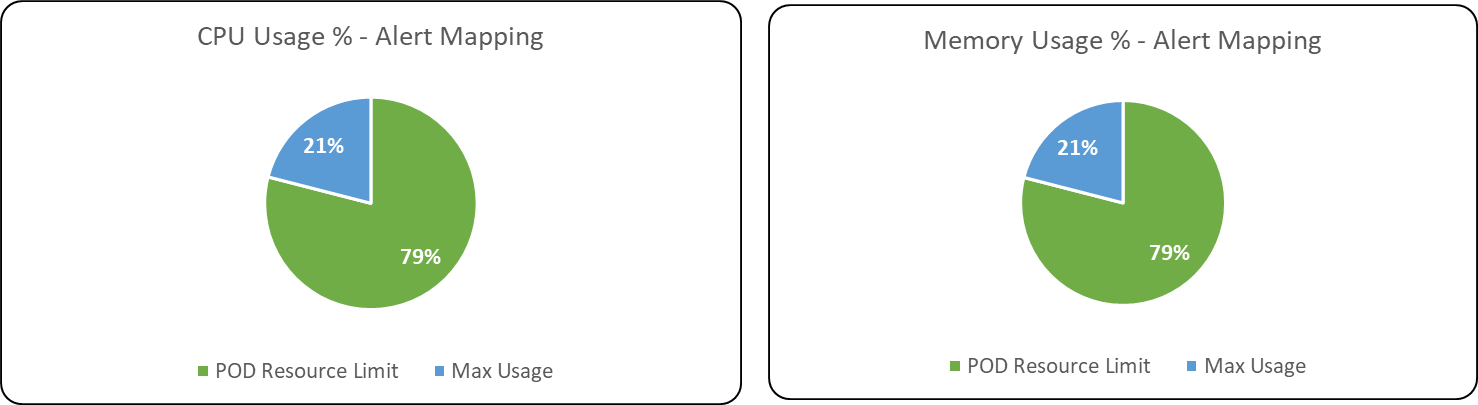
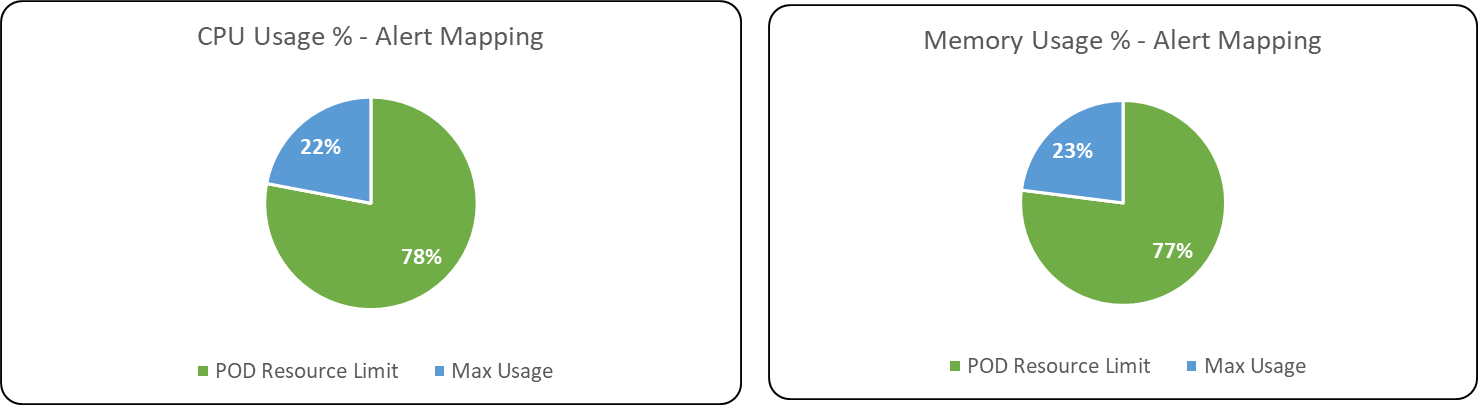
Following are the percentage wise use of CPU & Memory of each application components,
Max usage represents the maximum value reached in resource usage (CPU, Memory) during the test run.
POD resource limit represents the max limit set in each component Kubernetes POD.
Test 1
Test 2
Test 1
Test 2
Test 1
Test 2
Test 1
Test 2
Test 1

Test 2
Test 1
Test 2
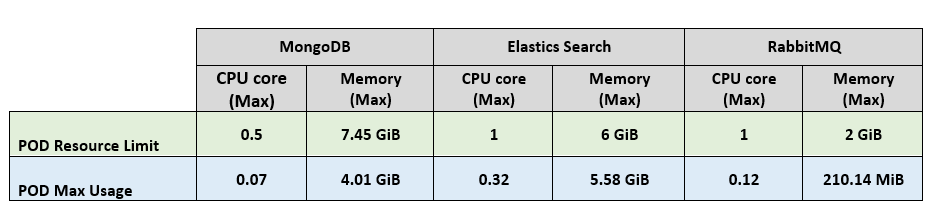
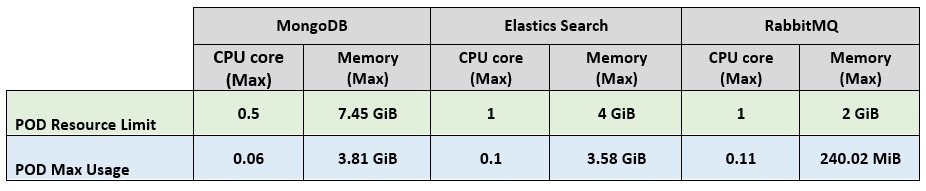
Databases & Message Broker
Test 1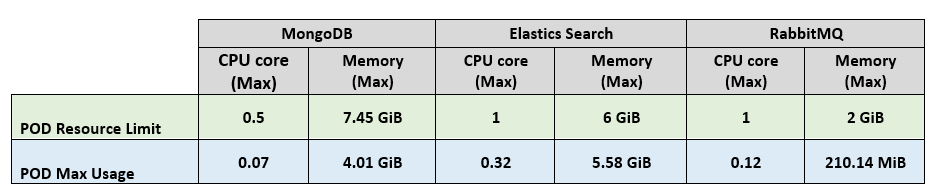
Test 2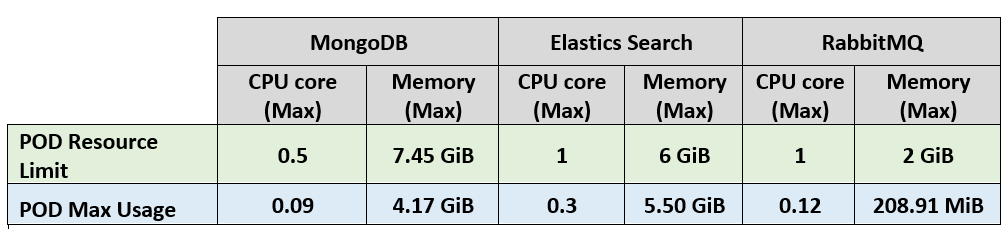
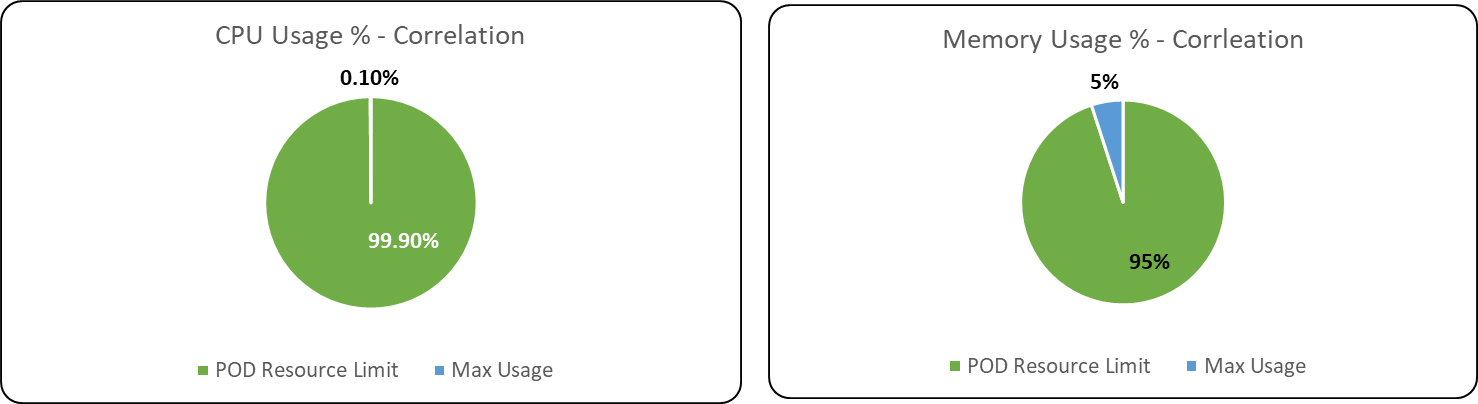
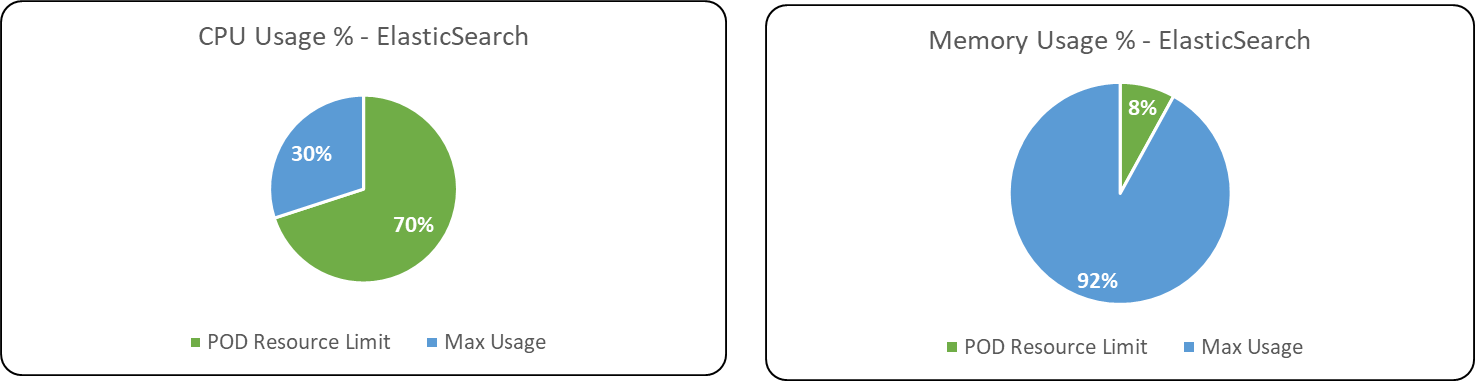
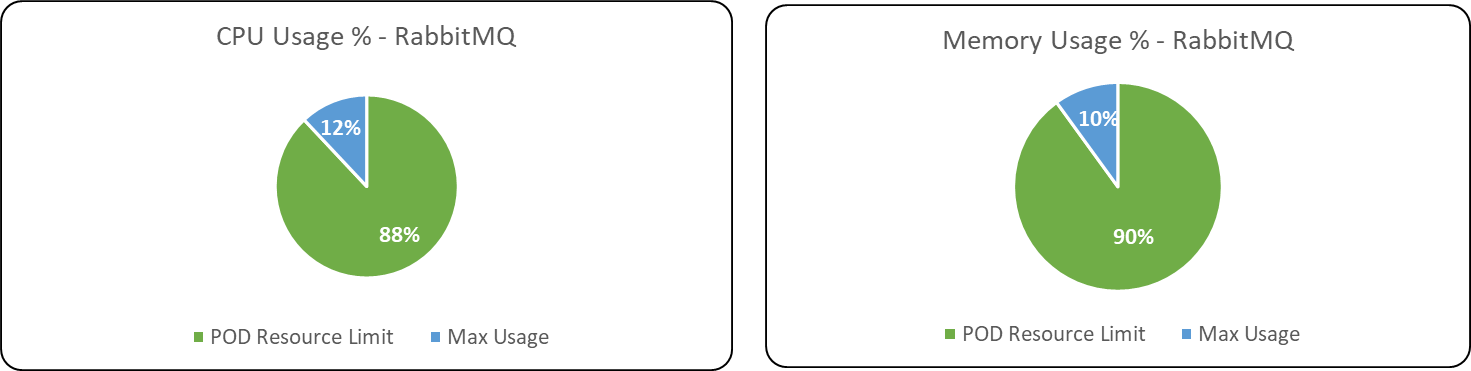
Following are the percentage wise use of CPU & Memory of each Database & Message Broker components of ITOps.
Test 1
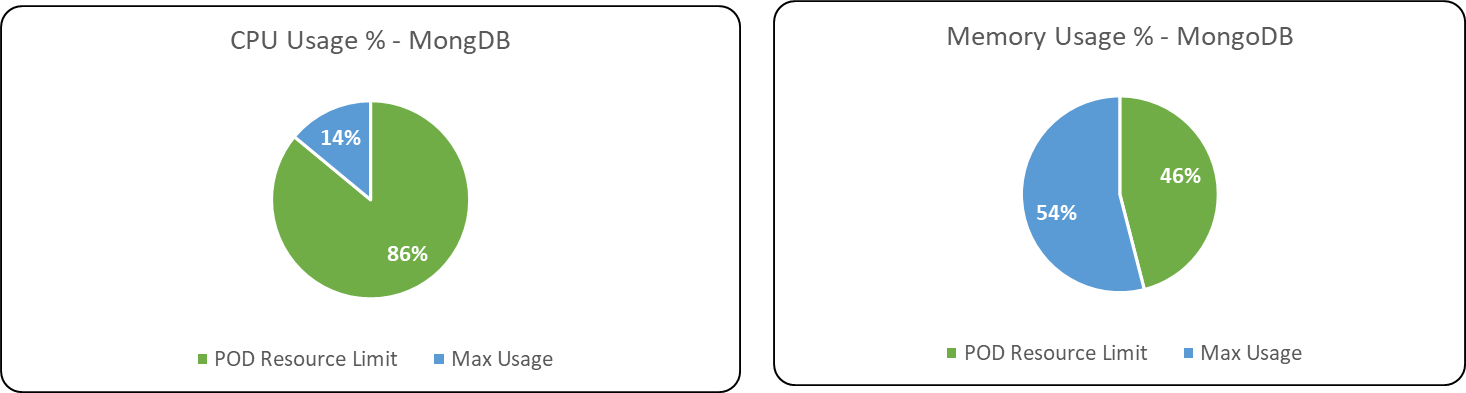
Test 2
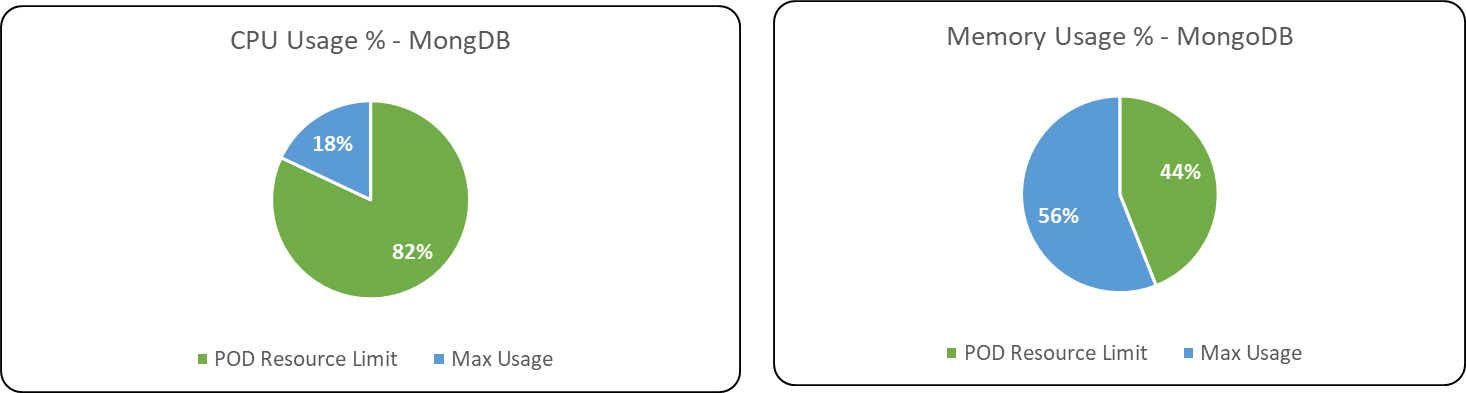
Test 1
Test 2
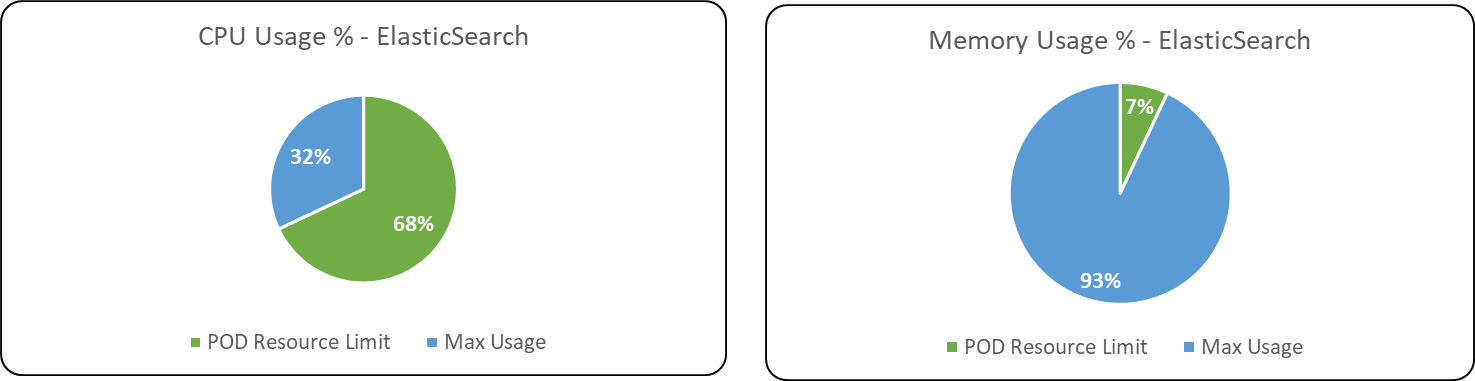
Test 1
Test 2

POD Autoscaling metrics
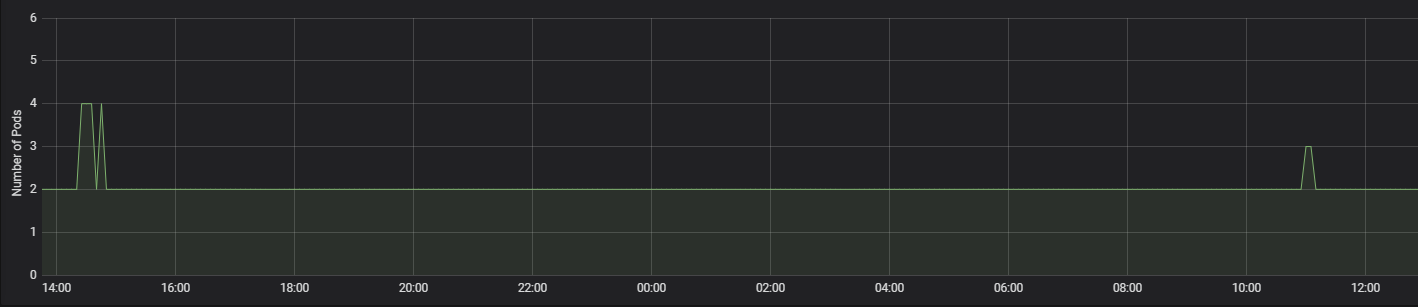
Following are the usage of replicas of POD’s of the ITOps components identified for Auto scaling. During both test executions its observed that apart from clones engine none of the components which had autoscaling enabled had any change on the pod replica count from its minimum value.
The below table summarizes the average, Max POD replica usage of the following ITOps components identified for autoscaling.
Test 1
|
POD replicas usage |
||
|
Container name |
Avg |
Max |
|
clones-engine |
2 |
4 |
|
itops-correlation |
2 |
2 |
|
itops-alertmapping |
2 |
2 |
Test 2
|
POD replicas usage |
||
|
Container name |
Avg |
Max |
|
clones-engine |
2 |
4 |
|
itops-correlation |
2 |
2 |
|
itops-alertmapping |
2 |
2 |
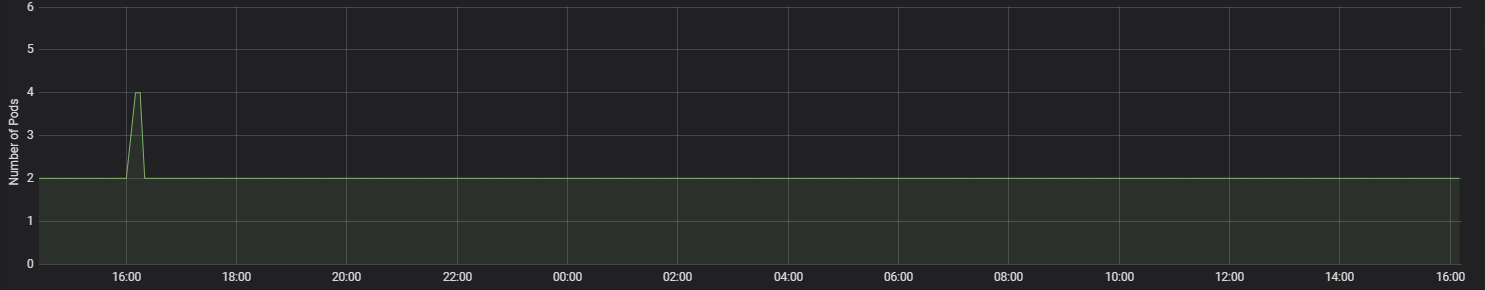
Following graph shows the clones engine POD replica usage during the test executions.
Test 1
Test 2
Performance test Observations & Recommendations
-
Based on the two test executions conducted with 21090, 21250 alerts spanned for a duration of 23 hrs & 25 hrs, its observed that there is significant improvement brought in on time taken for alert correlation in ITOps 1.3 compared to the previous versions of ITOps.
-
In first test execution time taken by each alert for correlation is 3.38 seconds (p90) and median time is 1.76 seconds and in second test execution the alert corelation time is 3.73 seconds (p90) & median time is 1.78 seconds per alert whereas in ITOps 7.1.2 it was 17.62 seconds (p90).
-
Both Test execution of ITOps 1.3 was conducted with each execution of correlation workflow having 55 alerts for alert correlation. With throughput of 55 alerts for correlation it was able to process each alert in 3.38 seconds (P90) & 3.73 seconds (p90). This is a good performance improvement as the ITOps system was able to process all the alerts received without any failures in reduced processing time during correlation of alerts.
-
The introduction of an API for handling Alert Correlation in ITOps 1.3 had considerably reduced the workflow execution time of Correlation Workflow. The average execution time of correlation workflow in ITOps 1.3 is 1.51 seconds compared with 294.57 seconds in ITOps 7.1.2.
-
Its observed that resource usage of alert correlation is relatively very less compared to resource limit set in both versions of ITOps. The CPU usage in both versions is only 0.001 core whereas the resource limit set is 1 core, with the high volume of alerts used in performance test only 0.001 core was needed, so the CPU resource limit can be reduced to a lower value.
-
Similar to CPU usage, in alert mapping component memory usage is also relatively very less compared with resource limit set (1.5 GIB), In both version performance test the memory usage is below 100 MiB, so the resource limit of memory can also be reduced to a lower value.
-
Its observed that memory usage of Elastic Search is reaching very close to resource limit value in all the 3 POD’s, In ITOps 7.1.2 resource limit of memory was 4 GiB and in ITOps 1.3 it was increased to 6 GiB, still the memory usage is very close to the resource limit value. So, platform team can have any analysis on the high memory usage.
-
*** Based on the resource usage collected from the two test executions conducted its observed that resource usage (CPU & Memory) of alert correlation, alert mapping, clones sense queue, iHub component, iHub Service is very less compared with respect to POD resource limit being set.
-
To identify the ideal resource configurations of those components another test execution will be conducted by setting lower resource values in CPU & Memory. The test result of that execution will be shared based on its completion.
Performance test metrics comparison- ITOps 1.3 & 7.1.2
Time taken for Alert correlation
|
ITOps version |
Correlation Workflow Alert Threshold Count |
Correlation Workflow Scheduler Interval |
Time Taken for correlating each alert (seconds) |
|
|
90 Percentile |
Median |
|||
|
7.1.2 |
20 |
2 |
17.62 |
14.94 |
|
1.3 |
55 |
3 |
3.38 |
1.76 |
There is significant improvement introduced in time taken for alert correlation in ITOps 1.3, it took only 3.38 seconds (P90) for each alert correlation where as in ITOps 7.1.2 it was 17.62 seconds (P90).
Workflow Execution Time
In correlation workflow execution time also there is considerable improvement in ITOps 1.3 compared with 7.1.2, the average workflow execution time is only 1.51 seconds where as in 7.1.2 it was 294.60 seconds
|
ITOps Version |
Correlation Workflow |
|||||
|
Execution Time (Seconds) |
Queue Time (Seconds) |
|||||
|
Avg |
Min |
Max |
Avg |
Min |
Max |
|
|
294.57 |
204.355 |
475.41 |
1.11 |
0.27 |
118.82 |
|
|
1.3 |
1.51 |
0.97 |
16.60 |
2.53 |
0.35 |
742.62 |
|
ITOps Version |
Ticket Update Scheduler |
|||||
|
Execution Time (Seconds) |
Queue Time (Seconds) |
|||||
|
Avg |
Min |
Max |
Avg |
Min |
Max |
|
|
7.1.2 |
15.92 |
10.60 |
42.25 |
0.53 |
0.24 |
1.14 |
|
1.3 |
14.60 |
2.82 |
34.33 |
8.0 |
0.34 |
743.14 |
|
ITOps Version |
Auto close Flap Cluster |
|||||
|
Execution Time (Seconds) |
Queue Time (Seconds) |
|||||
|
Avg |
Min |
Max |
Avg |
Min |
Max |
|
|
7.1.2 |
5.71 |
1.83 |
36.46 |
0.53 |
0.26 |
1.04 |
|
1.3 |
5.42 |
2.53 |
41.87 |
5.88 |
0.36 |
743.18 |
Resource Usage
Application Components
ITOps 1.3
ITOps 7.1.2
Database & Message Broker
ITOps 1.3
ITOps 7.1.2
Infrastructure Cost
Following is the approximate pricing for the infrastructure used for the performance test of ITOps 1.3.
More details on the Hardware Infrastructure used for Performance test is shown below.
|
Product / Flavour |
Minimum |
Maximum |
|
ITOps |
₹161,588.30 |
₹245,829.38 |
Please note that this is indicative and actual billing could vary based on network usage, operations, data etc.
ITOps Infrastructure configuration
|
Kubernetes Nodes |
Hardware Infrastructure |
Node Count |
||
|
Min |
Max |
|||
|
Application Node Pool Components Smartops-pwf, ihub-component, ihub-services, itopsui, clones, clones-sense, clones-sense-queue, alertmapping, correlation, smartops-keycloak |
Azure D8sv3 CPU - 8 vCPU Core RAM: 32 GB |
3 |
6 |
|
|
Persistent Pool Components MongoDB, RabbitMQ, Elastic Search, Kibana |
Azure D4sv3 CPU - 4 vCPU Core RAM: 16 GB |
3 |
5 |
|
|
MySQL |
Azure Managed MYSQL General Purpose, 2 Core(s), 8GB RAM Storage: 100 GB (Auto Grow Enabled) |
NA |
NA |
|
Performance test Execution results
Raw data collected as part of test execution is available on the following SharePoint location