AIOps 2.0 - Performance Test Report
Contents
- Overview
- Performance Testing – Workload Parameters
- Test Environment - Infrastructure setup
- Performance test environment setup
- Performance Testing - Software Used
- Performance Testing – ITOps components & Replicas
- Performance Test Approach
- Performance Test -Summary
- Performance Metrics Captured
- Ticket Sync Metrics
- Alert Correlation Time
- Time taken for correlation of each alerts is 5.43 seconds (p90) and median time is 3.91 seconds
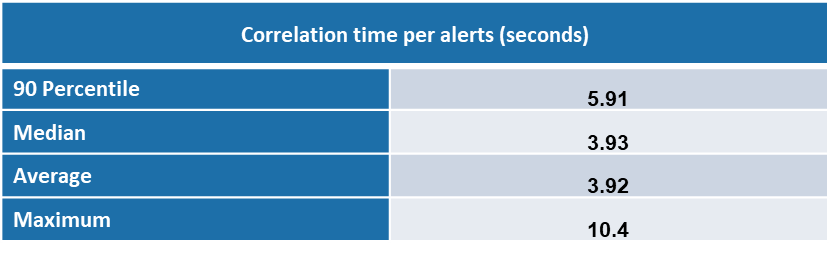
- Time taken for correlation of each alerts is 5.91 seconds (p90) and median time is 3.93 seconds
- IHub Alert Processing Time
- Clones Workflow Execution Time
- Performance Test – Infrastructure Resource Usage
- Clones Engine
- Clones Sense Queue
- iHub Component
- iHub Services
- Alert Correlation
- Alert Mapping
- POD Autoscaling metrics
- Performance test Observations & Recommendations
- Performance test metrics comparison- ITOps 2.0.1 & 1.4
- Infrastructure Cost
- Performance test Execution results
Overview
SmartOps ITOps manages alerts and notifications from multiple monitoring agents for an organization.
It supports automatic creation of Service Now tickets against alerts and provides intelligent root-cause suggestions by correlating with existing open tickets. It avoids creation of duplicate tickets by identifying similar open tickets or root tickets based on the dependency topology.
ITOps 2.0.1 provides provision to create projects in 3 different flavours.
-
SmartNOC
-
Smart Desk
-
SmartResolution
Smart NOC monitor alerts from different sources and create tickets in ITSM using alert correlation. Projects created using SmartNOC flavour serves as a Monitoring Project.
Smart Desk monitor tickets in ITSM. It uses manual/automated resolutions to resolve tickets created.
Projects created using SmartNOC flavour serves as a Support Project
Smart Resolution monitor alerts from different sources. It can create ticket in ITSM using alert correlation. It uses manual or automated to resolve tickets in ITSM. Projects created using Smart Resolution flavour acts as both Monitoring & Support project.
Performance Testing – Workload Parameters
The following parameter define the workload of performance testing of ITOps using Queue channel.
|
SYSTEM WORKLOAD PARAMTERS |
|
|
|
|
|
Total sample Alerts |
18310, 10660 |
|
Test Duration |
30 hrs, 18 hrs |
|
Monitoring Agent type |
SolarWinds |
|
Type of Alerts |
UP, DOWN, WARNING, CRITICAL, NOTIFICATIONS |
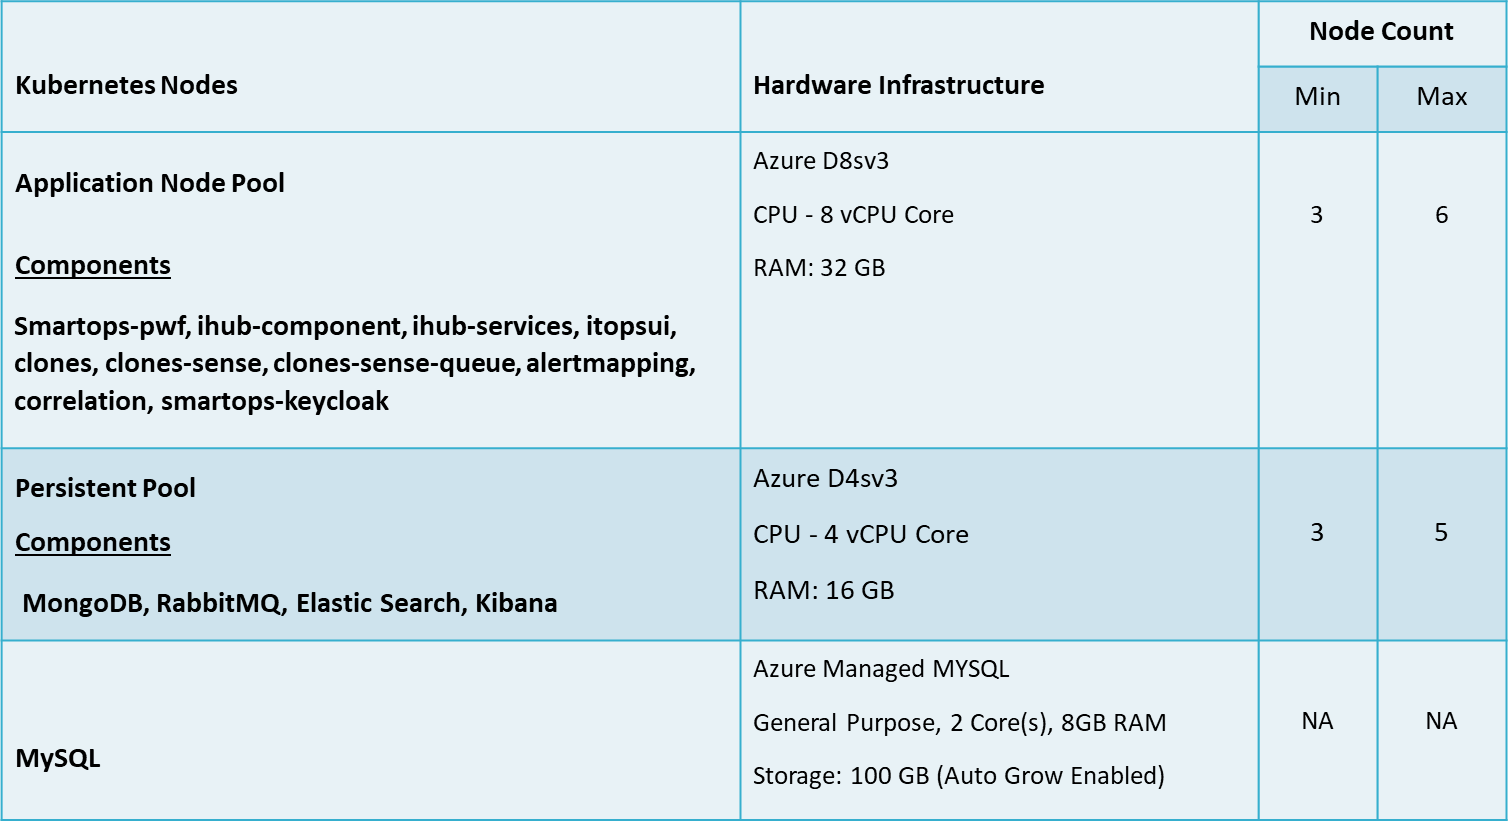
Test Environment - Infrastructure setup
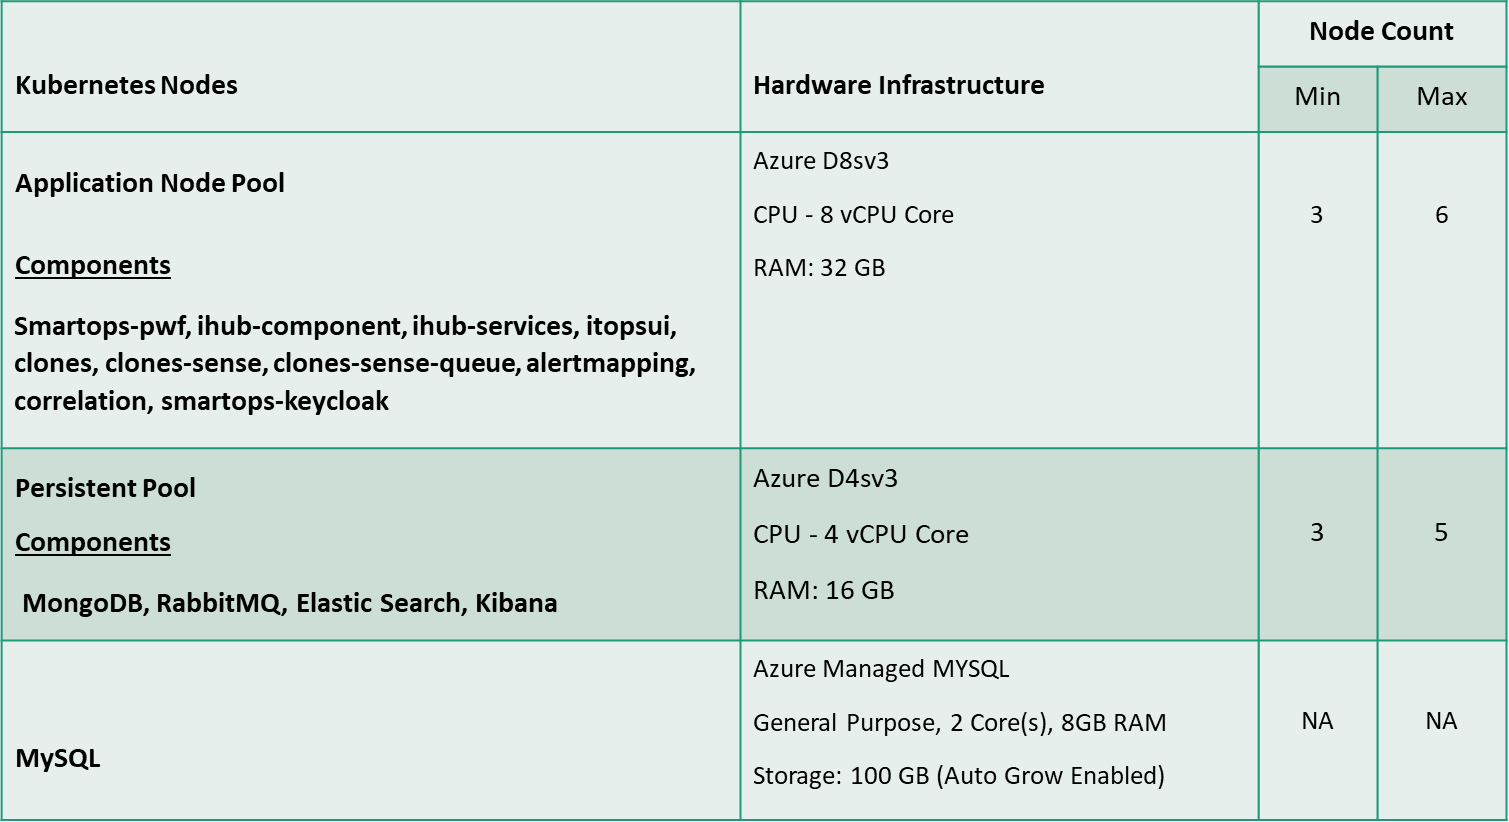
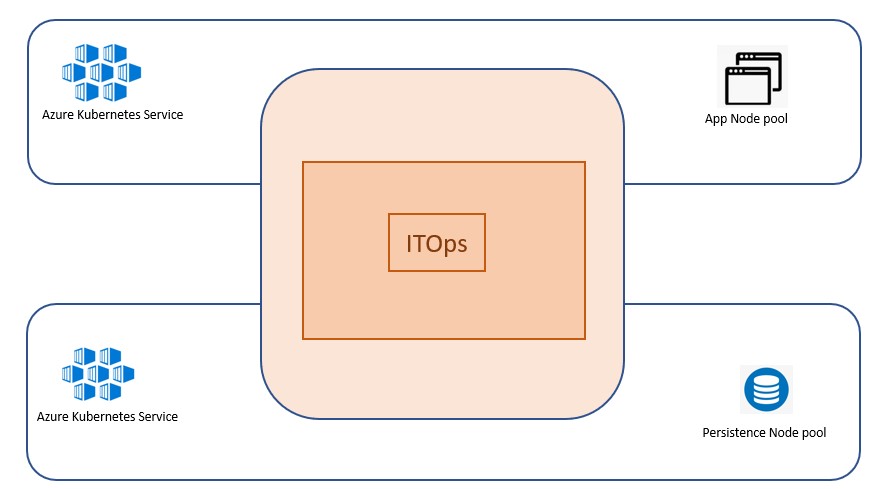
ITOps components, IHub, Clones, Databases & Message Broker are hosted in Kubernetes environment in Azure cloud.
Performance Testing is conducted with the following configuration of Kubernetes Cluster hosted in Azure. The Kubernetes ITOps cluster comprises of 2 different types of node pools such as Application Node Pool, Persistent Node Pool.
MYSQL is hosted as an Azure Managed Service.
The below table summarizes the hardware configuration & Number of VM & components hosted in each Node Pools.
Performance test environment setup
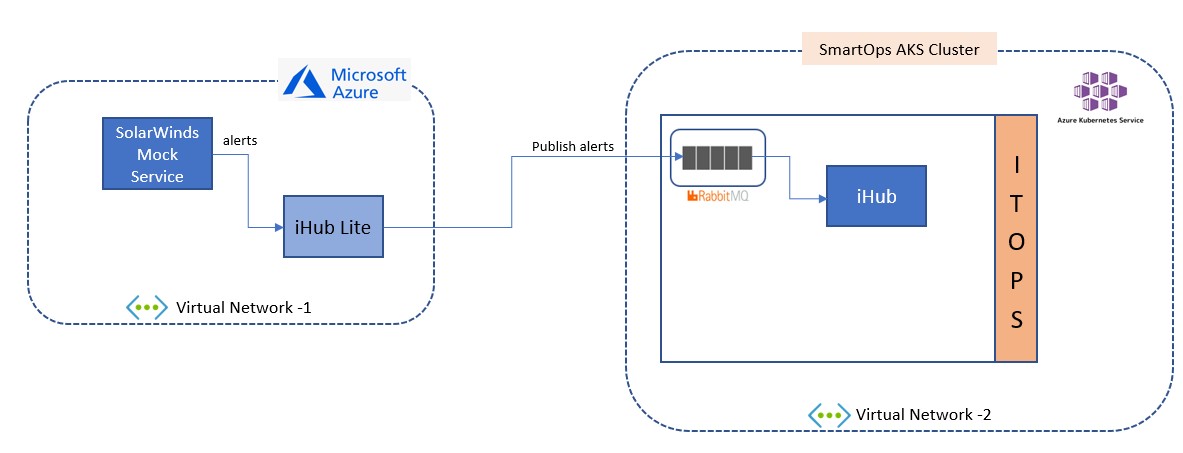
To replicate a production-based Infrastructure environment IHub Lite & SolarWinds based mock service are hosted in an Azure VM hosted at Azure cloud in a different virtual network.
IHub main along with ITOps components are hosted at Kubernetes environment in Azure cloud in another virtual network.
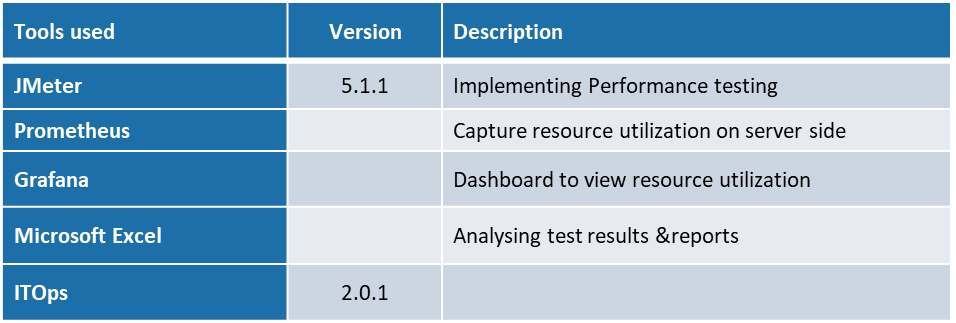
Performance Testing - Software Used
Following Tools used as part of performance testing
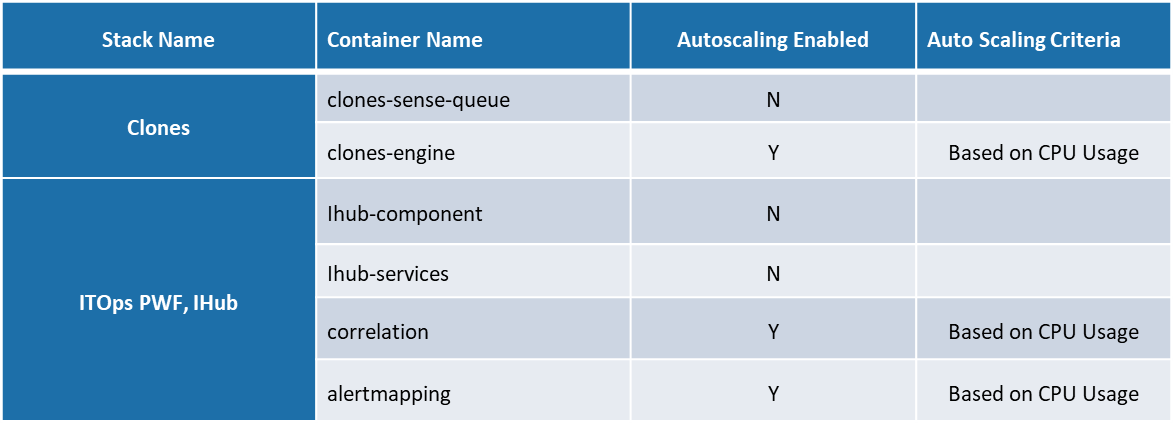
Performance Testing – ITOps components & Replicas
The below table provides details of docker containers of different components associated with ITOps such as Clones, ITOps components, Clones, iHub, Database & Message Broker.
This also provides detail of components identified for Autoscaling and the criteria defined for Autoscaling. As part of ensuring availability of non-scalable components to avoid failures of any components during document processing, 2 instances of each components are by default available in the Kubernetes cluster.
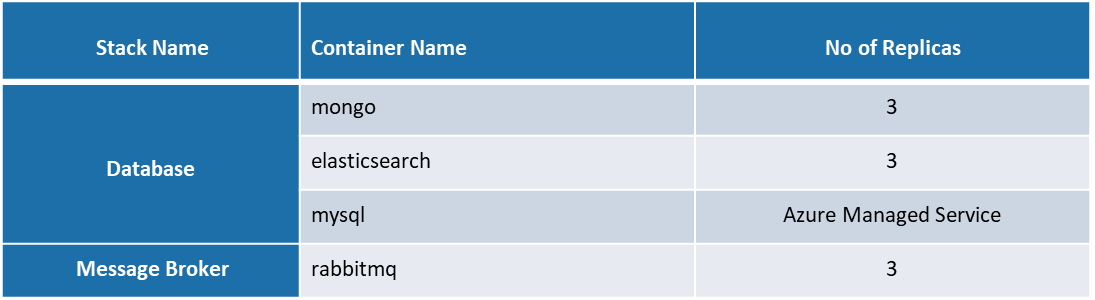
Following are the details of replicas configured for Database & Message Broker in Kubernetes cluster MySQL is deployed as a Managed service at Azure.
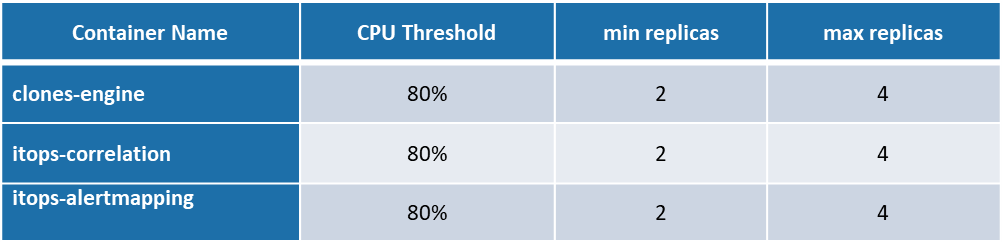
Autoscaling Configurations
Following are the CPU threshold limits, Replicas (Minimum & Maximum) configured for each component identified for Autoscaling in Kubernetes cluster for ITOps.
Performance Test Approach
Performance Testing of ITOps is conducted by sending system alerts & notifications captured by SolarWinds monitoring agent. A SolarWinds monitoring agent based mock service is created to simulate different types of System alerts such as UP, DOWN, Warning, Critical alerts & notifications alerts are simulated by the mock service.
This service is polled continuously by IHub Lite API scanner channel in a fixed interval and the polled data is pushed to ITOps Queue system from which the alerts are processed further by IHub main & ITOps. SolarWinds based mock service simulates alerts archived from a production-based system.
Test is conducted by simulating different counts of system alerts by mock service in a specific interval at different alert times. This helps in creating system alerts workload like a production-based environment.
To capture performance metrics on ticket creation and its resolution in ITSM, support based ITOps project is created using Smart Desk as flavour. This project helps in capturing the details of tickets created in ITSM as part of test execution.
Performance Test -Summary
Performance Testing of ITOps is conducted by sending SolarWinds based alerts samples simulated from a SolarWinds mock service continuously for a duration of 30 hrs.
Test is conducted with SolarWinds mock service simulating 10 alerts every minute. The mock service simulates alerts archived a production system. This also helps us in verifying the functionalities of ITOps processing as the alert data archived replicates all the alert scenarios & patterns occurred in a real production system.
IHub lite API scanner channel polls the mock service continuously in an interval of 1 minute and IHub lite channel publishes the alerts to ITOps Queue from which further processing of alerts starts.
This test report is prepared based on the metrics collected from last 2 test execution conducted using alert data archived from a production system.
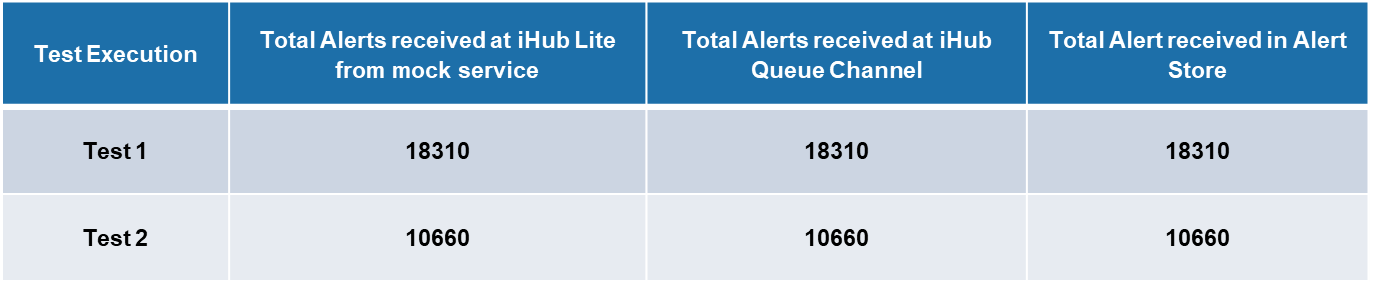
Following are the counts of alerts received at IHub Lite, IHub Queue channel & Alert store. There was no missing of alerts observed in the test execution.
Performance Metrics Captured
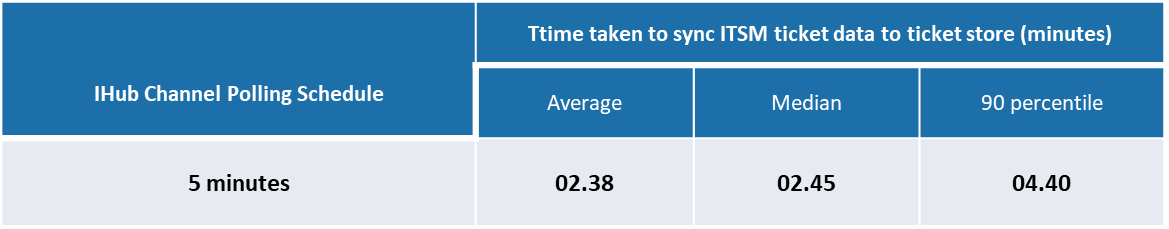
Ticket Sync Metrics
Metrics on Tickets created in ITSM based on the system alerts received at ITOps system from SolarWinds mock service as part of the test execution is captured. In ITOps 2.0.1 the ITSM ticket created and its resolutions status are synced into a ticket store created by ITOps support project created with Smart Desk favour. This metrics helps us identifying the time taken for syncing the data of each tickets created in an ITSM into the ticket store of ITOps support project ticket store.
Following are the time taken to sync data of each tickets created to the ticket store of ITOps support project.
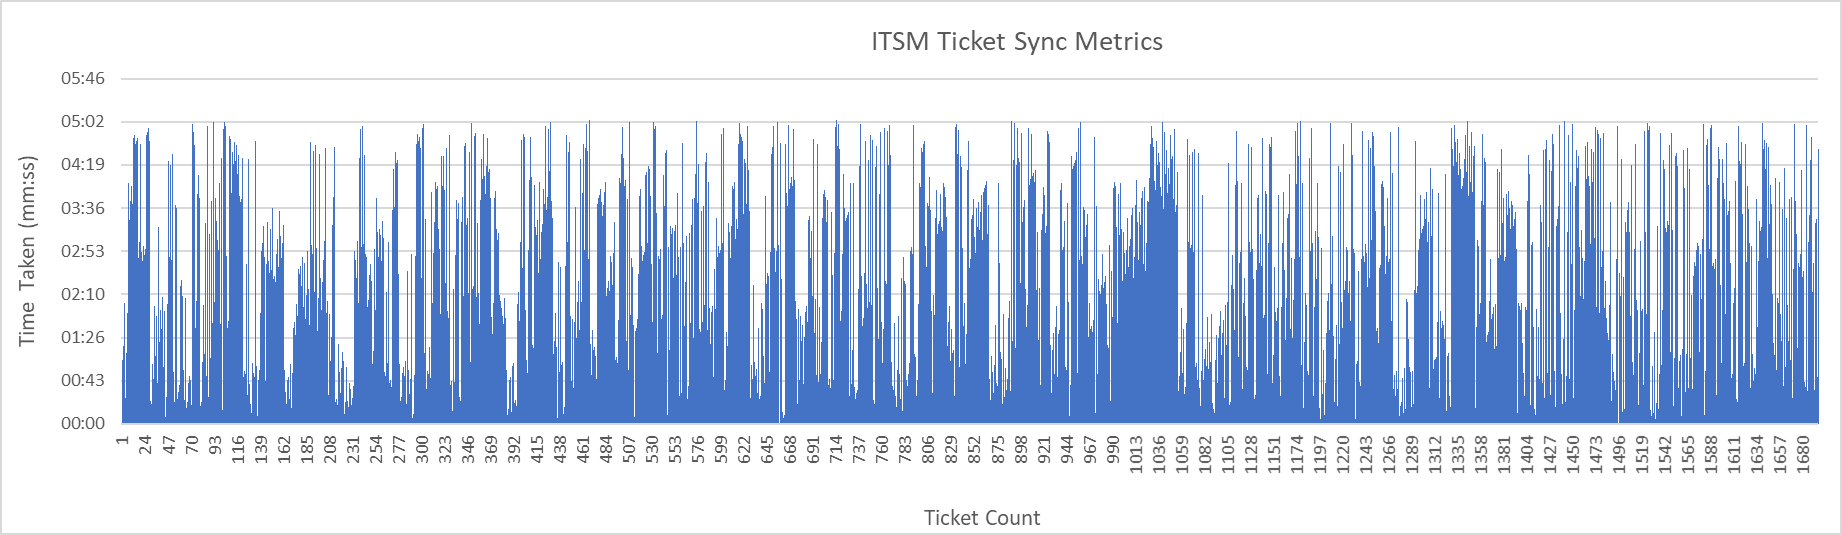
Graphical representation of time taken to sync ITSM Ticket in ticket store
Alert Correlation Time
To capture the time taken for the correlation of similar and related alerts, the test is conducted by simulating 10 alerts every minute from the mock service. This type of alert simulation pattern ensures that each time the SolarWinds mock service is polled, the count of alerts received will be matching the like a production system workload.
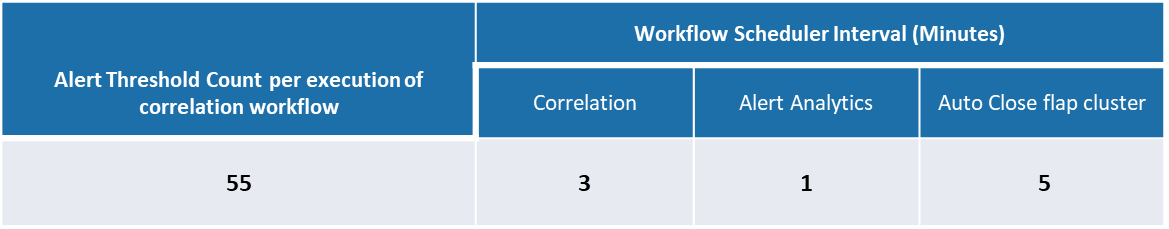
Following are the threshold count of alerts set for correlation workflow and the duration of the schedulers for Correlation, Alert analytics & Auto closure flap cluster configured during the multiple test executions.
Alert Threshold count per execution of workflow represents the count of alerts taken by correlation workflow during each execution of the workflow as part of alert correlation.
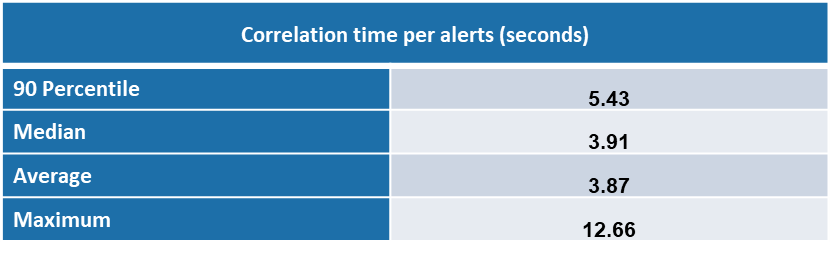
Following are the time taken for alert correlation during the test executions conducted with above mentioned configuration of alert threshold and workflow scheduler time.
Test 1
Time taken for correlation of each alerts is 5.43 seconds (p90) and median time is 3.91 seconds
Test 2
Time taken for correlation of each alerts is 5.91 seconds (p90) and median time is 3.93 seconds
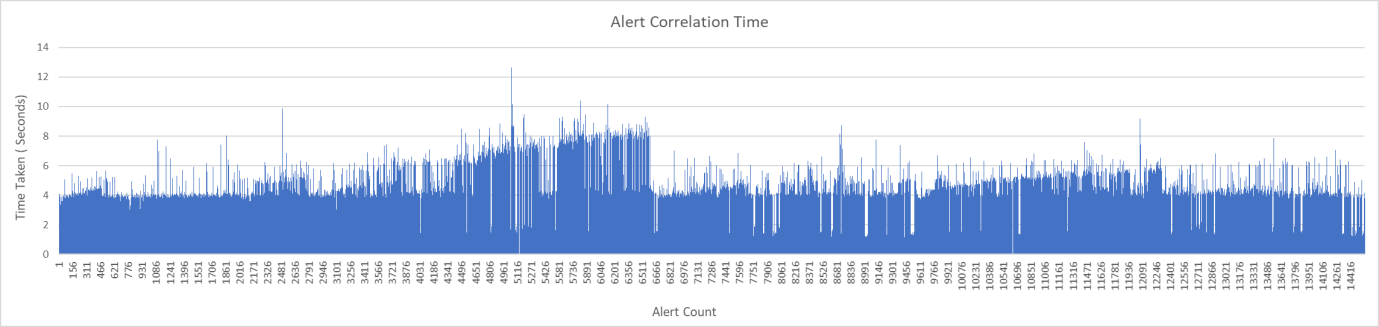
Following is the graphical representation of time taken for correation of each alerts. Test 1
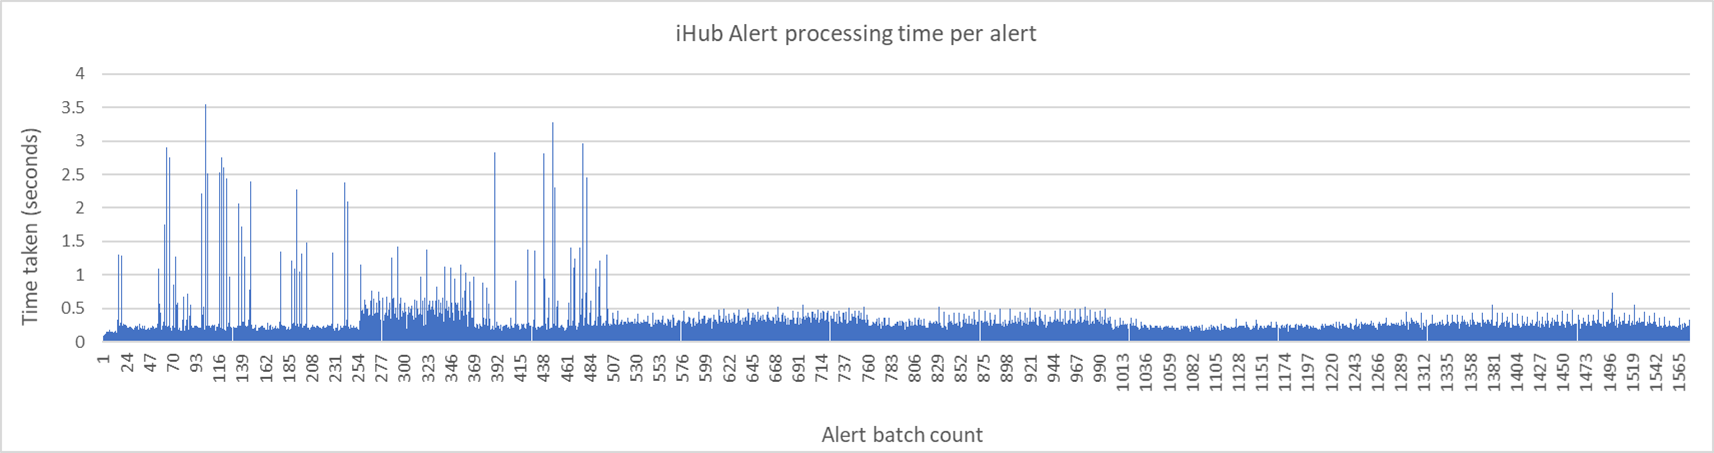
IHub Alert Processing Time
The following graph shows the time taken in the processing of alerts in IHub. This also involves the time taken in the transformation of alerts received from IHub Lite channel to SmartOps Platform message format.
Alerts are received as batches each time when iHub main polls the ITOps Queue with each batch having different counts of alerts simulated from SolarWinds mock service.
Median time taken by iHub in processing each alert received in different batch is 0.28 seconds
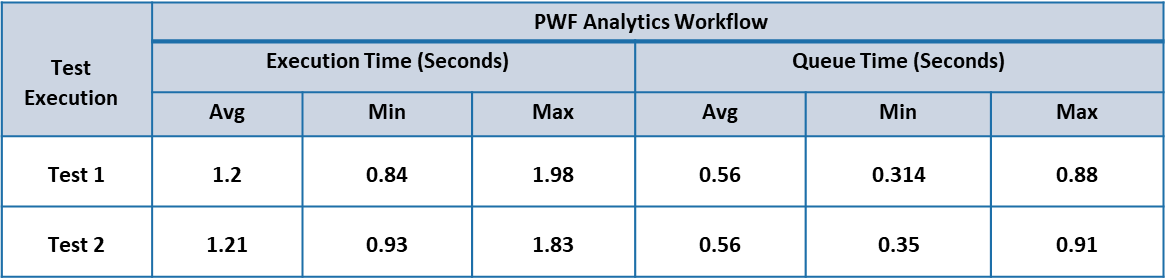
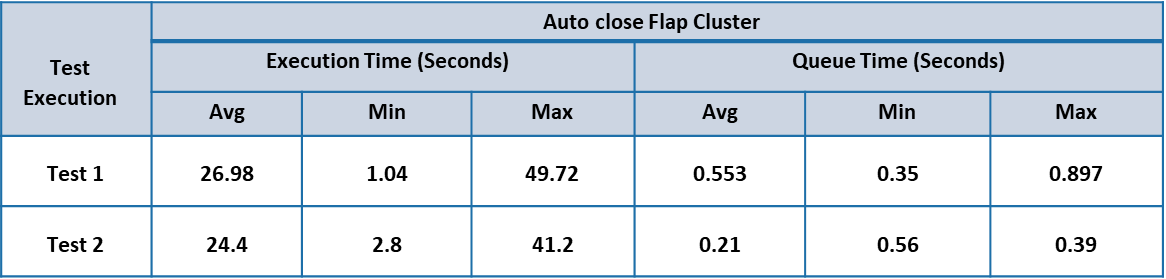
Clones Workflow Execution Time
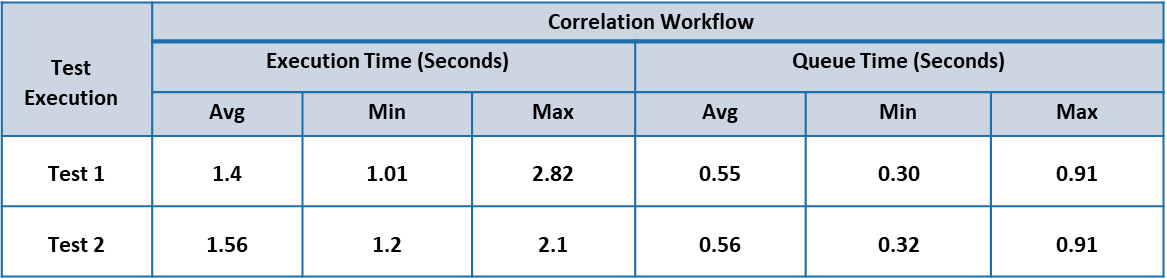
This captures the time taken (Queue & Execution time) for the execution of workflows such as Correlation, PWF Analytics, Auto close flap cluster by clones engine as part of processing different system alerts.
Each workflow has different steps of micro actions and there is a Queue phase & Execution phase involved in each of steps.
Below table summarizes the Average, Min, Max time taken in Queue & Execution phase involved in each step associated with a workflow during the test executions.
Performance Test – Infrastructure Resource Usage
Following are the CPU & Memory usage of various components in ITOps during the test executions. Application components
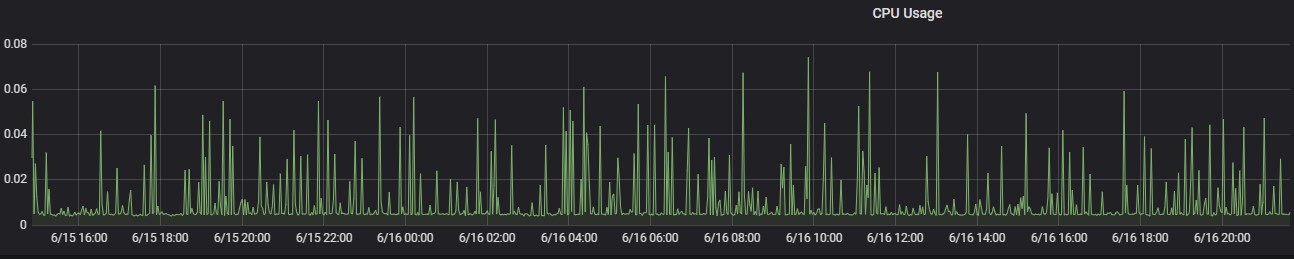
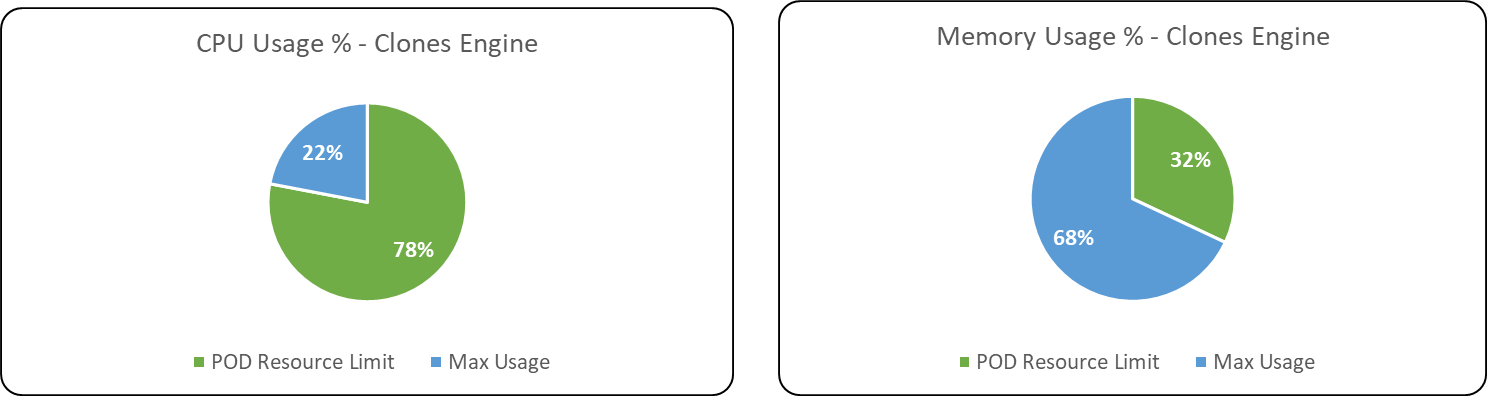
Clones Engine
Its observed during test execution that CPU usage in POD’s hadn’t reached above threshold limit at any instance and as a result autoscaling of clones engine didn’t got initiated.
The max CPU usage was only 0.4 core and max memory usage was 5.40 GiB during both test execution.
Following is the summary of the of occurrence of the POD replica count in clones engine during the test execution.
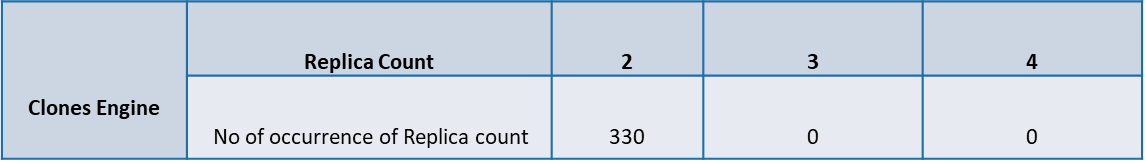
POD Replica usage pattern of clones engine during test execution is as follows:
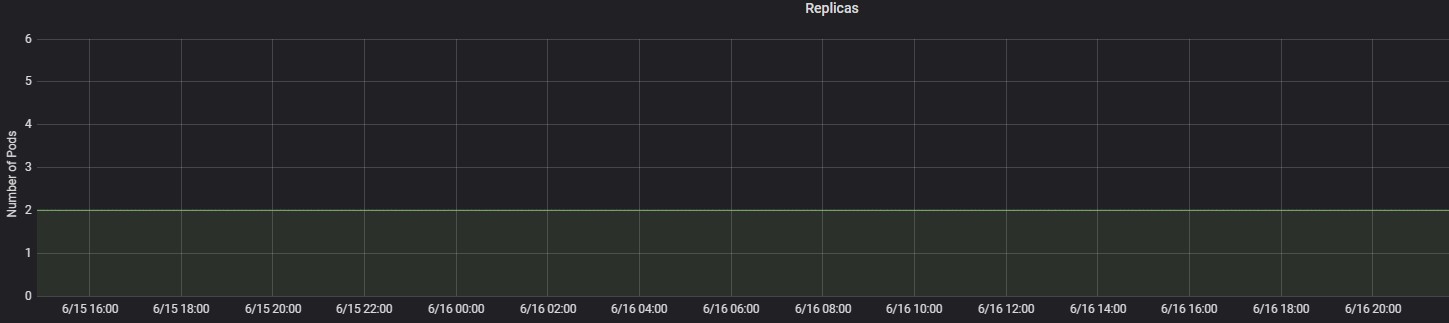
Followings are the graphical representation of CPU usage of multiple POD’s of clones engine during the test execution.
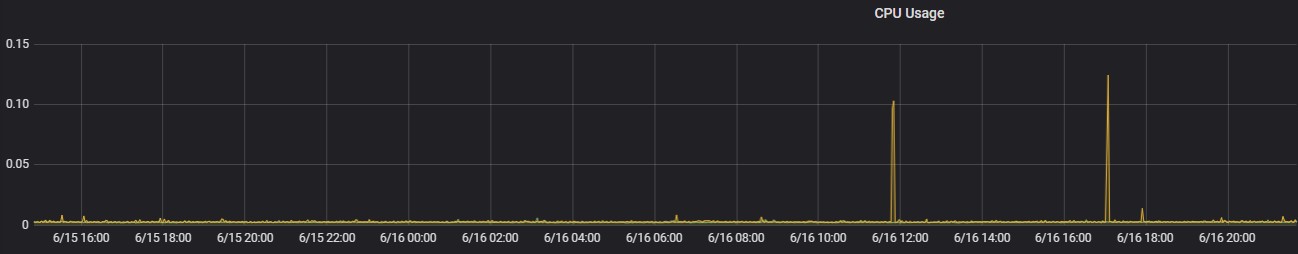
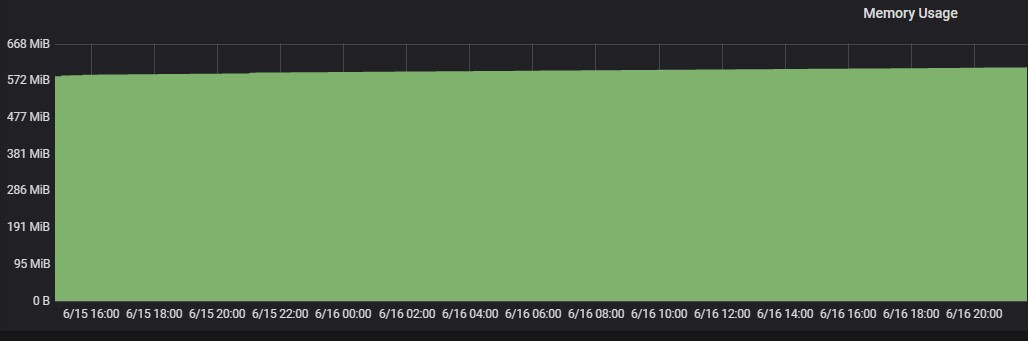
Other application components
The following tables shows the max CPU & Memory usage of other application components of ITOps.
Even though Auto scaling was enabled in alert correlation & alert mapping component the replica count of both components remained as 2 throughout the test execution.
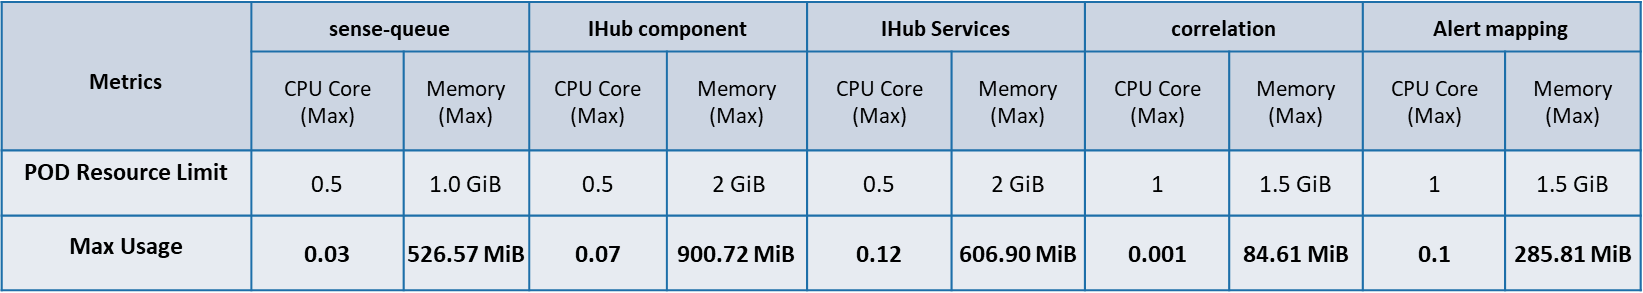
Following are the CPU & Memory usage of other application components in ITOPs
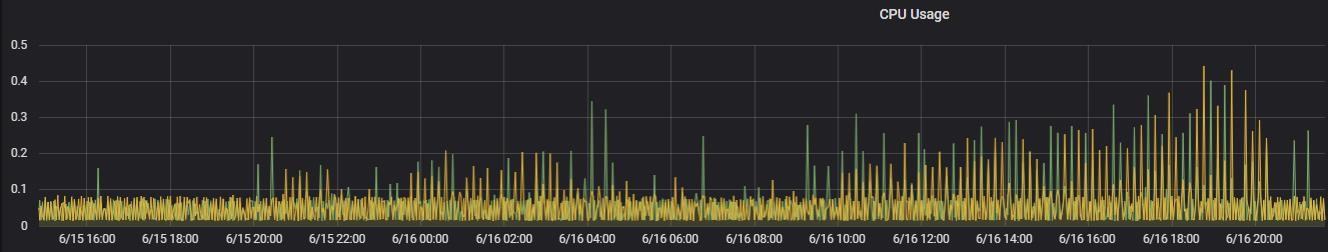
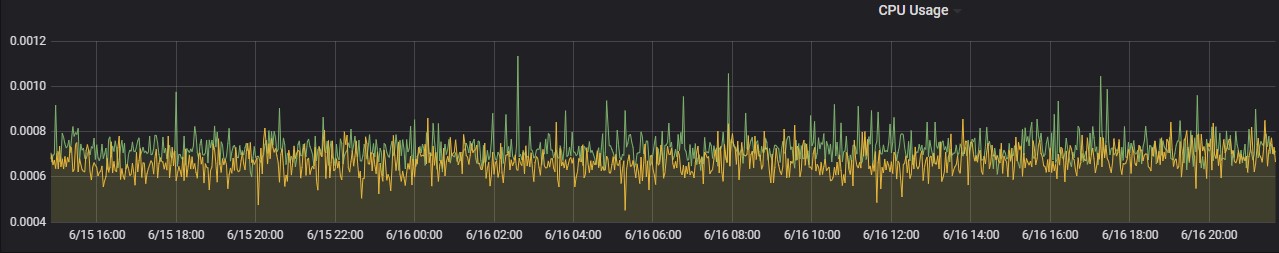
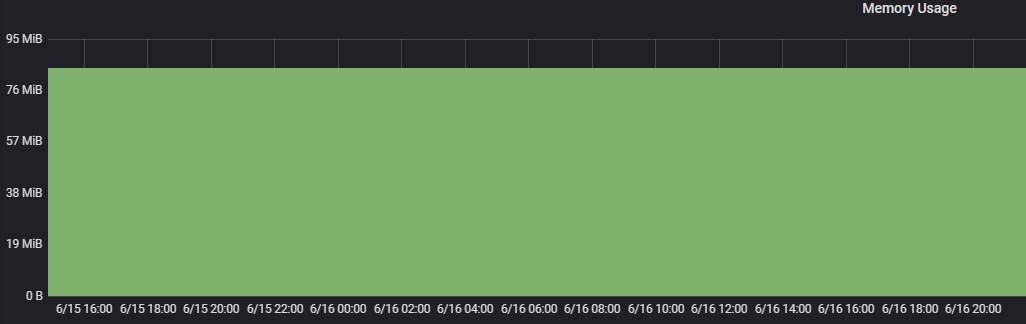
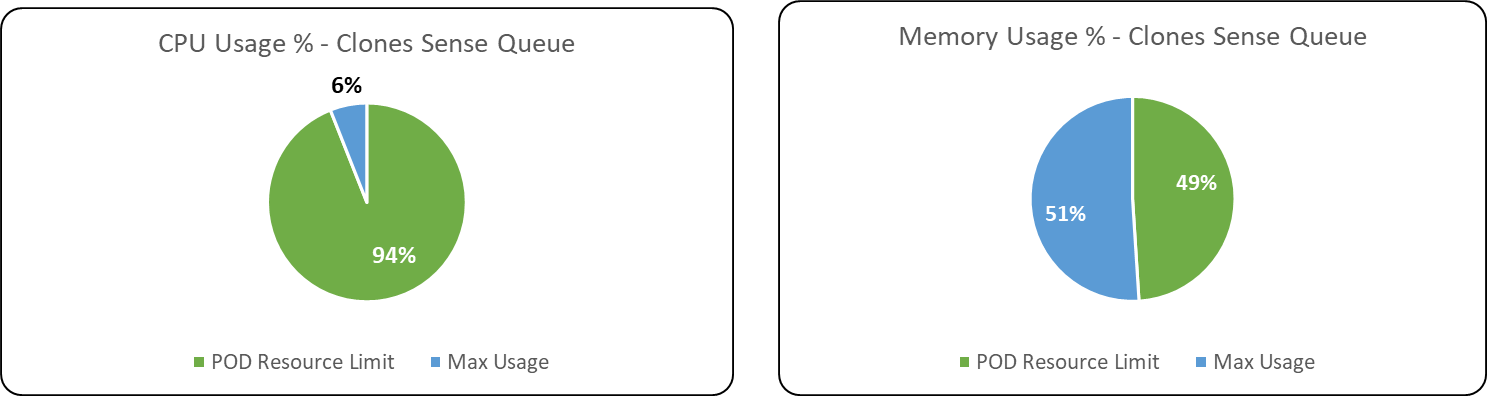
Clones Sense Queue
CPU Usage
Memory Usage
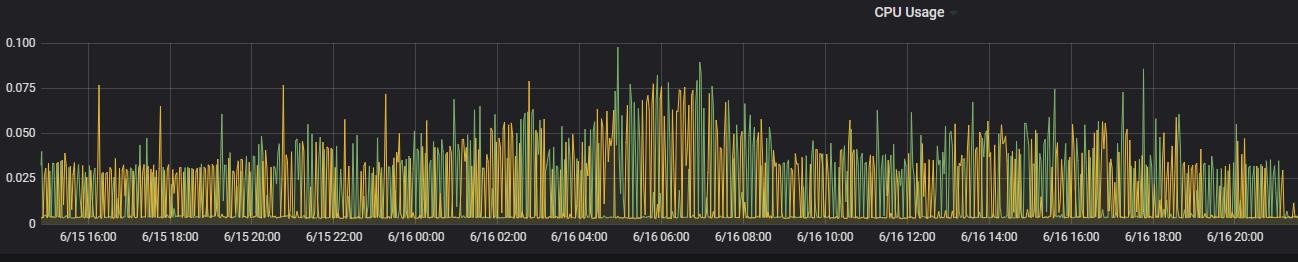
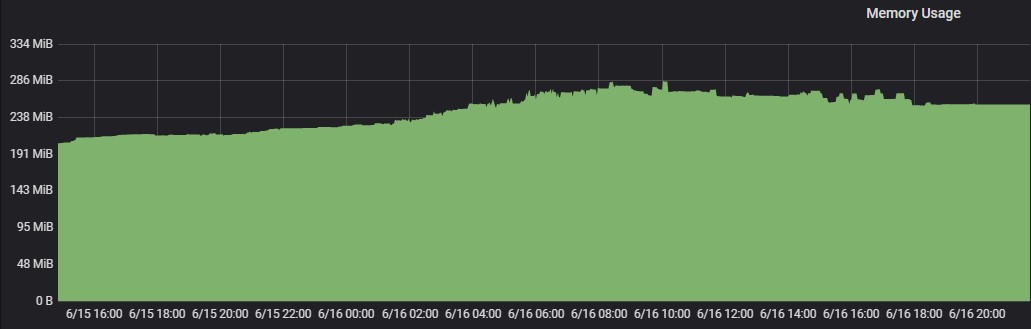
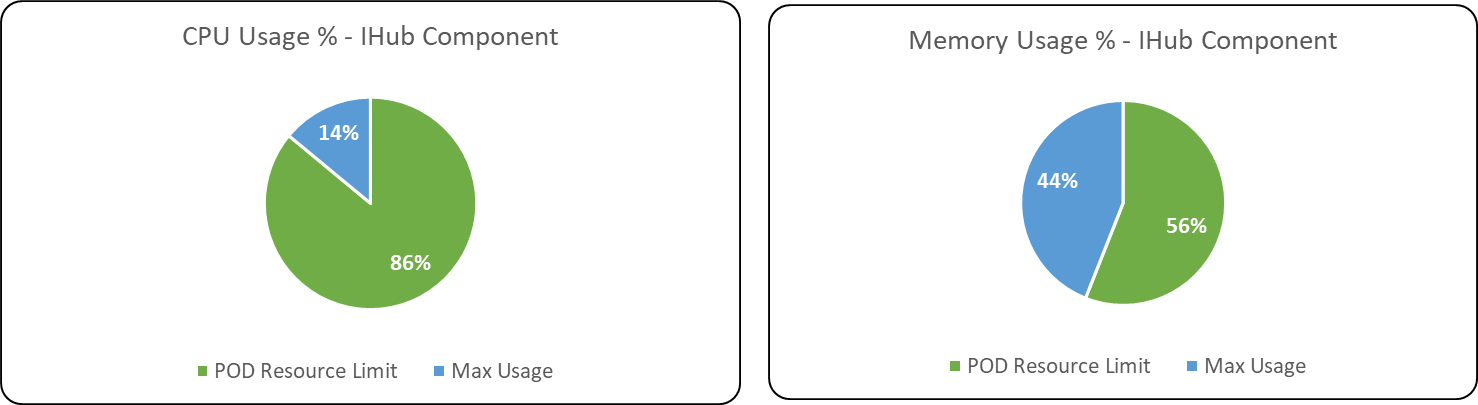
iHub Component
CPU Usage
Memory Usage
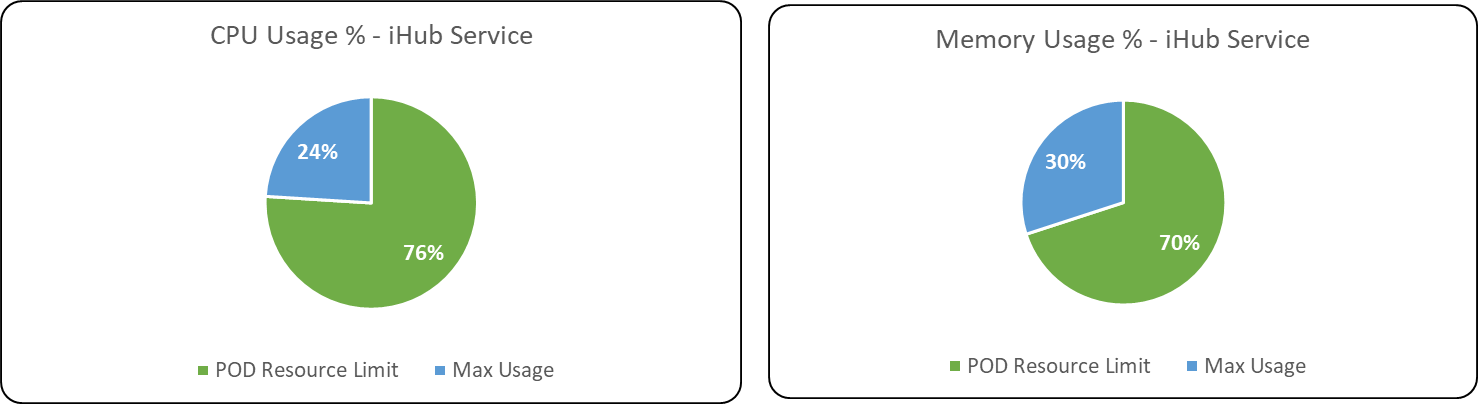
iHub Services
CPU Usage
Memory Usage
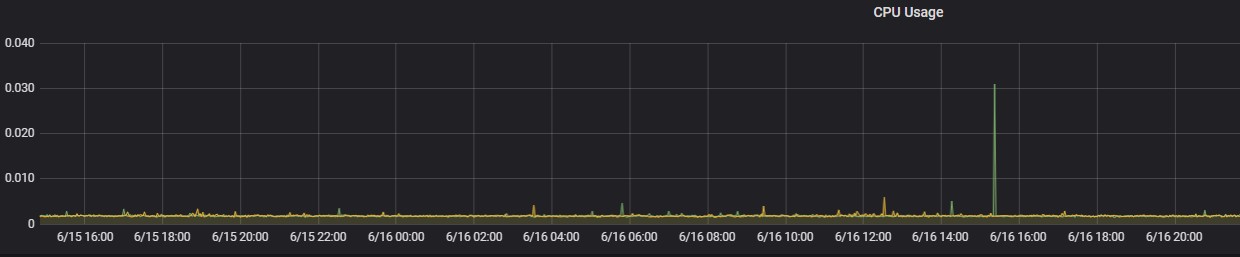
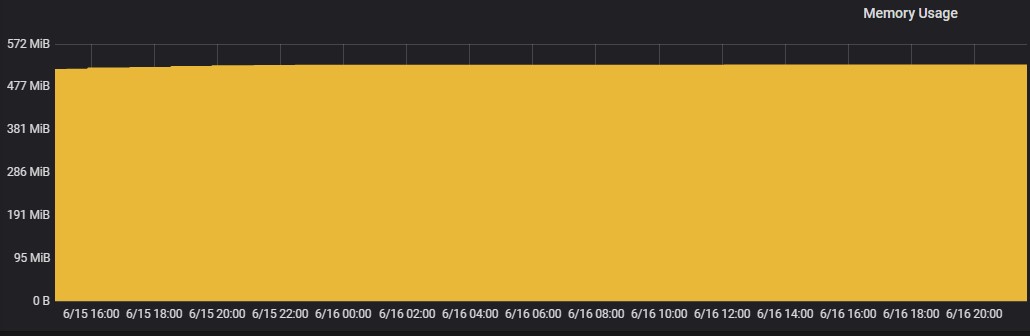
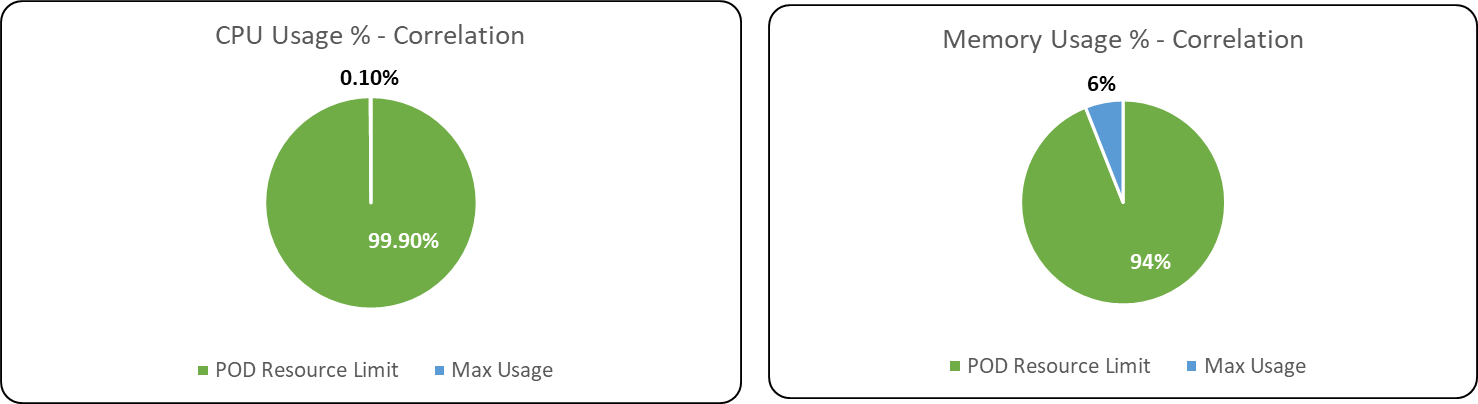
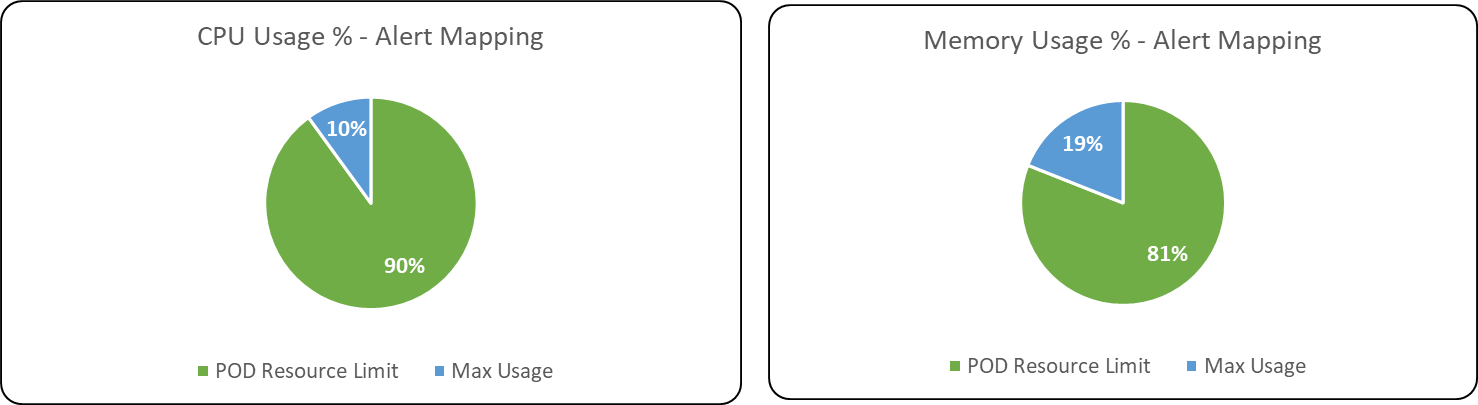
Alert Correlation
CPU Usage
Memory Usage
Alert Mapping
CPU Usage
Memory Usage
Following are the percentage wise use of CPU & Memory of each application components.
Max usage represents the maximum value reached in resource usage (CPU, Memory) during the test run. POD resource limit represents the max limit set in each component Kubernetes POD.
Databases & Message Broker
Below table summarizes the CPU & Memory max usage of the database & message broker components used by ITOps.
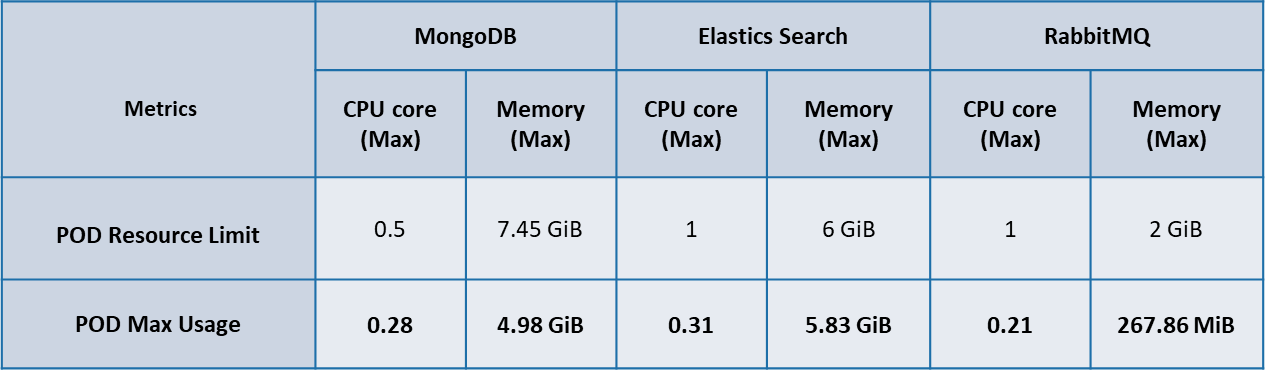
Following are the percentage wise use of CPU & Memory of each Database & Message Broker components of ITOps.
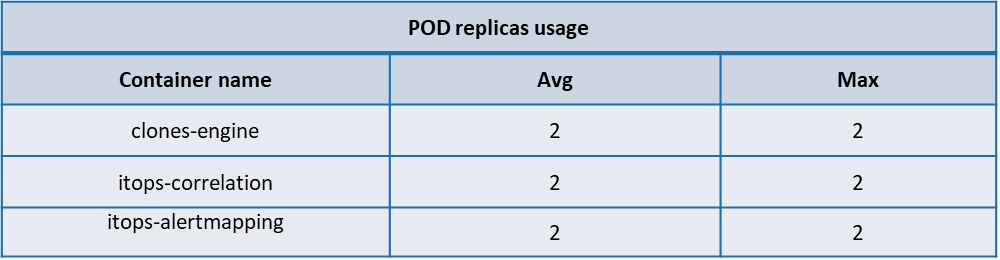
POD Autoscaling metrics
Following are the usage of replicas of POD’s of the ITOps components identified for Auto scaling. During test executions its observed that none of the components which had autoscaling enabled had any change on the pod replica count from its minimum value.
The below table summarizes the average, Max POD replica usage of the following ITOps components identified for autoscaling.
Performance test Observations & Recommendations
-
Multiple test executions conducted using 18310, 10660 alerts spanned for a duration of 30 hrs & 18 hrs respectively SolarWinds mock service was configured to simulate 10 system alert samples every minute.
-
Each execution of correlation workflow was configured to accept maximum 55 alerts for alert correlation, with alert correlation threshold count set to 55 time taken for the correlation of each alert sample is 5.43 seconds (P90) & median time taken is 3.91 seconds in 1st test execution. In 2nd test execution the alert correlation time taken for each alert is 5.91 seconds (P90) & median time taken is 3.93 seconds.
The time taken for alert correlation in ITOps 2.0.1 is slightly higher in comparison with ITOps ver.1.4 which is due to new API calls introduced in 2.0.1.
-
Its observed during 1st test execution that there were few ITSM ticket data missing in ticket store of support project in comparison with the count of ITSM ticket data available in ticket store of monitoring project. This was raised as an issue and platform team had provided fix on the ticket data missing in latest deployment.
-
It’s also observed during 1st test execution that the time taken in the sync of ITSM ticket data in ticket store of support project is comparatively higher in case of certain alerts. This issue was reported to platform team and based on the updated deployment which has the fix for the issue observed, the 2nd test execution was conducted.
-
Its verified in 2nd test execution that count of tickets in both Monitoring Project ticket store and Support project ticket store exactly matches and all the ISTM tickets created are synced correctly without any failures and also the time taken for ticket data sync to ticket store has considerably improved. The median time taken for ITSM ticket data sync was 2.45 minutes in 2nd test execution.
-
There is slight improvement observed in the workflow execution time & Queue time of correlation workflow in ITOps 2.0.1 in comparison with ITOps 1.4.
-
Memory usage in all the POD’s of Elastic search is high and the usage is constantly above 5 GB throughout the two test executions. The average memory usage is 5 GB in all the 3 POD’s.
-
The resource usage (CPU & Memory) of iHub Component, IHub Services, Alert Correlation, Alert mapping is Comparatively very less in compared with POD resource configuration limits being set. So, its recommended to lower the resource configuration limits identified in ITOps Components Resource configuration optimization test.
Performance test metrics comparison- ITOps 2.0.1 & 1.4
Time taken for Alert correlation
|
ITOps version |
Correlation Workflow Alert Threshold Count |
Correlation Workflow Scheduler Interval (Minutes) |
Time Taken for correlating each alert (seconds) |
|
|
90 Percentile |
Median |
|||
|
2.0.1 |
55 |
3 |
5.43 |
3.91 |
|
1.4 |
55 |
3 |
4.11 |
3.69 |
There is slight increase observed in time taken for alert correlation in ITOps 2.0.1, it took 5.43 seconds (P90) for each alert correlation where as in ITOps 1.4 it was 4.11 seconds (P90).
Workflow Execution Time
Following are the comparison of the Execution & Queue time metrics of the different workflows of ITOps executed during test execution conducted in ver. 2.0.1 & 1.4.
|
ITOps Version |
|
|
Correlation Workflow |
|
||
|
E |
xecution Time (Se |
conds) |
Q |
ueue Time (Seconds) |
||
|
Avg |
Min |
Max |
Avg |
Min |
Max |
|
|
2.0.1 |
1.4 |
1.01 |
2.82 |
0.552 |
0.302 |
0.91 |
|
1.4 |
1.65 |
1.2 |
3.9 |
2.51 |
0.36 |
172.7 |
|
ITOps Version |
|
PWF Analytics |
|
|||
|
E |
xecution Time (Seconds) |
Q |
ueue Time (Seconds) |
|||
|
Avg |
Min |
Max |
Avg |
Min |
Max |
|
|
2.0.1 |
1.2 |
0.84 |
1.98 |
0.556 |
0.314 |
0.884 |
|
1.4 |
1.5 |
0.93 |
34.1 |
0.97 |
0.33 |
119.42 |
|
ITOps Version |
|
Auto close Flap Cluster |
|
|||
|
E |
xecution Time (Seconds) |
Q |
ueue Time (Seconds) |
|||
|
Avg |
Min |
Max |
Avg |
Min |
Max |
|
|
2.0.1 |
26.98 |
1.04 |
49.72 |
0.553 |
0.35 |
0.897 |
|
1.4 |
4.80 |
3.14 |
15.8 |
1.65 |
0.44 |
59.57 |
Infrastructure Cost
Following is the approximate pricing for the infrastructure used for the performance test of ITOps 2.0.1. More details on the Hardware Infrastructure used for Performance test is shown below.
|
Product / Flavour |
Minimum |
Maximum |
|
ITOps |
₹161,588.30 |
₹245,829.38 |
Please note that this is indicative and actual billing could vary based on network usage, operations, data etc.
ITOps Infrastructure configuration
Performance test Execution results
Raw data collected as part of test execution is available on the following SharePoint location Test Data