(Impact of PDF Search step)
Contents
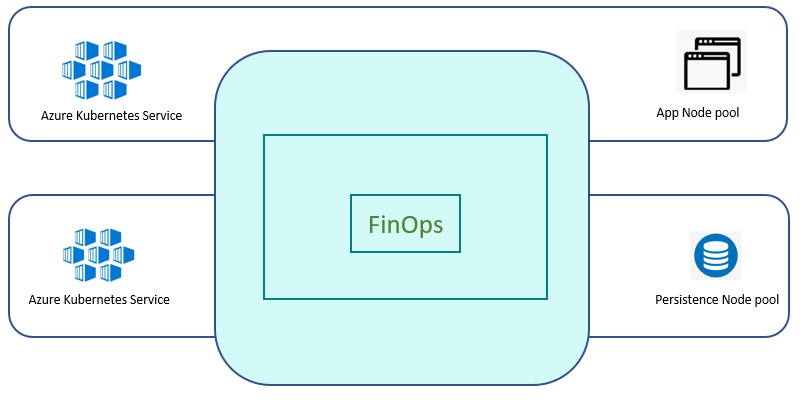
Performance test was conducted for SmartOps Kubernetes based Infrastructure hosted in Azure Cloud.
Test environment was deployed with Smart Extract pipeline and its related containers only. Vespa pipeline and its related containers are excluded in this test executions.
The below table summarizes the hardware Infrastructure along with Node count used for the Smart Extract infrastructure.
|
Kubernetes Nodes |
Hardware Infrastructure |
Node Count |
|
|
Min |
Max |
||
|
Application Node Pool Components DU (Smart-extract, smart-extract-predict, rest, pipeline, scheduler, invoice-split, page-split , invoice-image-ocr), Clones Engine, pwf-invoice-extraction-scheduler, pwf-invoice-extraction-listener, pwf-invoice-extraction-api, ie-ui |
Azure D8sv3 CPU - 8 vCPU Core RAM: 32 GB |
4 |
6 |
|
Persistent Pool Components Mongo, MinIO, RabbitMQ, Elastic Search, Kibana |
Azure D4sv3 CPU - 4 vCPU Core RAM: 16 GB |
3 |
6 |
|
MySQL |
Azure Managed MYSQL General Purpose, 2 Core(s), 8GB RAM, 100 GB (Auto Grow Enabled) |
NA |
NA |
Following Tools used as part of performance testing
|
Tool |
Version |
Description |
|
JMeter |
5.1.1 |
Implementing Performance testing |
|
Prometheus |
|
Capture resource utilization on server side. |
|
Grafana |
|
Dashboard to view resource utilization. |
|
Microsoft Excel |
|
Analyzing test results &reports. |
|
FinOps |
7.2 |
SmartOps FinOps application. |
The below table provides details of docker containers of different components associated with FinOps from Document Understanding (DU) , Clones, PWF, Database & Message Broker.
This also provides detail of components identified for Autoscaling and the criteria defined for Autoscaling. As part of ensuring availability of non-scalable components to avoid failures of any components during document processing, 2 instances of each components are by default available in the Kubernetes cluster.
|
Container Name |
Autoscaling Enabled |
Scaling Criteria |
|
|
Document Understanding |
du-rest |
Y |
Based on CPU Usage |
|
du-scheduler |
N |
|
|
|
du-pipeline |
Y |
Based on CPU Usage |
|
|
du-invoice-split |
N |
|
|
|
du-tilt-correct |
N |
|
|
|
du-smart-extract |
N |
|
|
|
du-invoice-image-ocr |
N |
|
|
|
clones-sense-queue |
N |
|
|
|
clones-engine |
Y |
Based on CPU Usage |
|
|
PWF |
pwf-Invoice-extraction-listener-du |
N |
|
|
pwf-invoice-extraction-listener |
N |
|
|
|
pwf-invoice-extraction-api |
N |
|
|
|
pwf-invoice-extraction-scheduler |
N |
|
Following are the details of replicas configured for Database & Message Broker in Kubernetes cluster MySQL is deployed as a Managed service at Azure.
|
Stack Name |
Container Name |
No of instances |
|
Database |
mongo |
3 |
|
minio |
2 |
|
|
elasticsearch |
3 |
|
|
mysql |
Azure Managed Service |
|
|
Message Broker |
rabbitmq |
3 |
Following are the CPU threshold limits, Replicas (Minimum & Maximum) configured for each component identified for Autoscaling in Kubernetes cluster for FinOps.
|
Container name |
CPU Threshold |
min replicas |
max replicas |
|
Clones-engine |
80% |
2 |
4 |
|
du-core-nlp |
80% |
2 |
4 |
|
du-pipeline |
80% |
2 |
4 |
|
du-rest |
80% |
2 |
4 |
Based on the optimal Invoice processing observed in previous tests, Smart Extract Engine and Invoice Image OCR POD replicas are set to 3. All the tests are conducted with this configuration.
|
Smart Extract Engine |
Invoice Image OCR |
|
3 |
3 |
|
DU Project setting |
Value |
|
Engine Pipeline |
Smart Extract |
|
Language Classifier |
Disabled |
|
Feedback Learning (HITL) |
Disabled |
|
Preprocessors Enabled |
Barcode Page Split, Skip Dup Validation |
File selected for processing has the below parameters.
Test is executed using Invoice samples of 51 per batch, each Invoice has 2 pages the first page being the Invoice scan page and second page is the invoice page.
Different vendor-based sample invoices are used consisting of Invoices of different complexity categorized as Low, Medium, High.
Test is executed 3 times to confirm a consistent result.
|
Parameter |
Value |
|
Main File Type |
Zip |
|
Zip file contents (Combined, Individual) |
1 PDF with combined Invoices |
|
No of Invoices combined in the zip file |
51 (102 pages) |
|
Pages per Invoice document. |
2 (1 scan and 1 invoice page) |
|
Invoice Batch. |
Batch consist of 51 Invoice samples each with 3 different variations of Invoices of Low, Medium, High complexity |
|
Number of fields extracted per invoice |
22 |
|
Insight Fields |
14 |
|
Line Items |
8 |
|
Infrastructure Variation - Document processing Engine |
Smart Extract Exclusive |
Comparison report before and after PDF search code changes. An addition of 3 minutes is noticed with PDF search code changes. This is the total time taken in DU to process 51 invoices used in the test.
|
Before PDF search |
After PDF search |
Impact |
|
19.57 |
22.53 |
An addition of 3 minutes (for 51 invoices) after PDF search code changes. |
Without PDF Search step:
|
Test Execution |
DU Time Taken (Minutes) |
|
|
First file processed |
Last file processed |
|
|
Test 1 |
3.48 |
19.46 |
|
Test 2 |
3.38 |
20.12 |
|
Test 3 |
3.46 |
19.13 |
With PDF Search step:
|
Test Execution |
DU Time Taken (Minutes) |
|
|
First file processed |
Last file processed |
|
|
Test 1 |
3.00 |
22.27 |
|
Test 2 |
3.35 |
23.23 |
|
Test 3 |
3.08 |
22.10 |
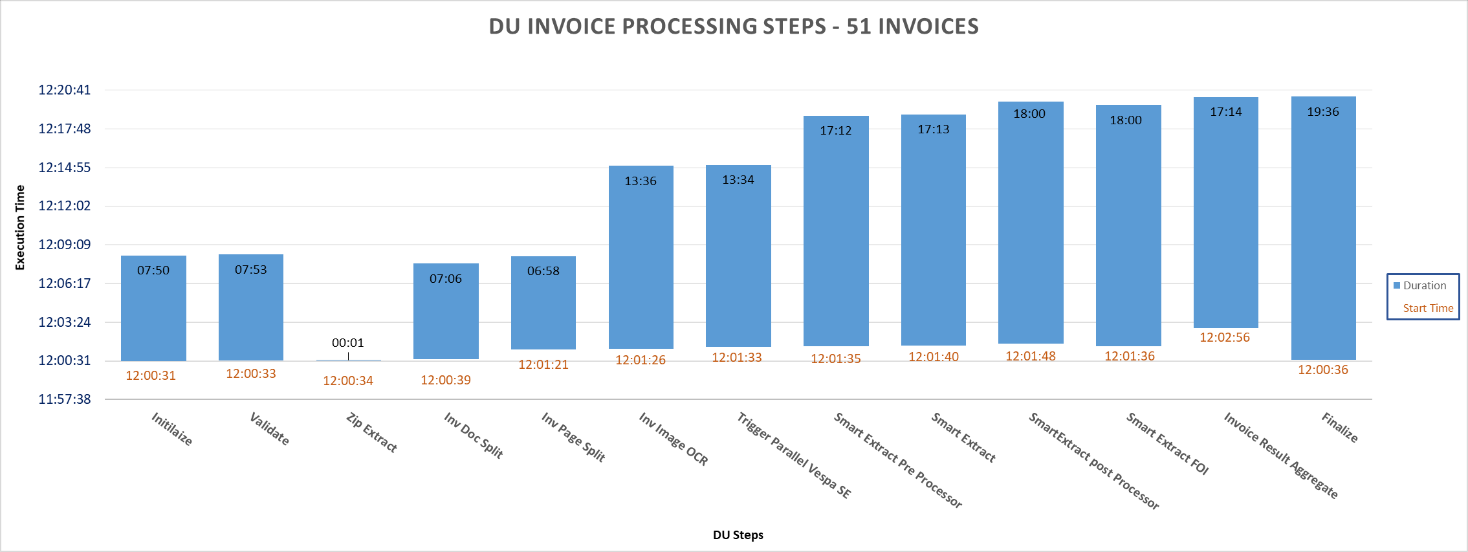
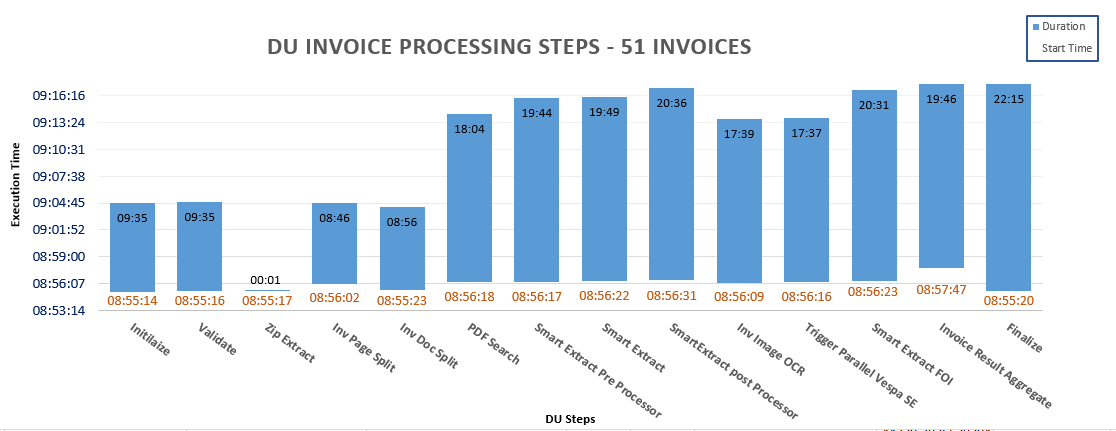
The following graph represents the time-based execution of the different steps of DU as part of the processing of the 51 Invoice sample for one of the test executions.
The blue bar represents the duration of execution of the different DU steps. This also help us in identifying the parallel execution details of the DU steps.
Without PDF Search step
With PDF Search step
It involves the time taken to execute the following workflow by clones engine as part of document processing.
Invoice_PWF_PushToDUSched is a scheduled workflow which polls the FTP folder to fetch the Invoice batch zip file and provides the zip file to the corresponding Document Understanding Project for data extraction.
Invoice_PWF_CheckRoleCondition workflow validates the role-based permission needed as part of the processing of invoice documents.
The below table summarizes the average time taken for the executions of different clones workflow.
Without PDF Search step
|
Clones Workflow (Seconds) |
||||
|
Invoice Batch |
Executions |
CheckRoleCondition |
Invoice PWF Installation |
PushToDUSched |
|
Sample -1 |
Test1 |
7.13 |
2.11 |
9.59 |
|
Test2 |
7.26 |
2.14 |
12.31 |
|
|
Test3 |
7.19 |
2.23 |
10.35 |
|
With PDF Search step
|
Clones Workflow (Seconds) |
||||
|
Invoice Batch |
Executions |
CheckRoleCondition |
Invoice PWF Installation |
PushToDUSched |
|
Sample -1 |
Test1 |
14.43 |
1.65 |
8.55 |
|
Test2 |
12.37 |
1.68 |
40.54 |
|
|
Test3 |
10.77 |
1.57 |
11.27 |
|
Time taken for the execution of different steps in Document extraction in DU as part of Invoice extraction. There are several steps involved in the processing of an Invoice document by Documents Understanding application. PDF search which is introduced in 7.2 recently is one among such step.
The result consists of data from one of the 3 test executions.
Without PDF Search step
|
DU Steps |
Execution Time (Seconds) |
||||
|
AVG |
MIN |
MAX |
Occurrence per batch |
Extended Time per batch |
|
|
INITIALIZE |
1.56 |
0.37 |
4.23 |
155 |
241.99 |
|
VALIDATE |
0.87 |
0.16 |
2.64 |
155 |
134.54 |
|
ZIP_EXTRACT |
1.24 |
1.24 |
1.24 |
1 |
1.24 |
|
INV_DOC_SPLIT |
426.20 |
426.20 |
426.20 |
1 |
426.20 |
|
INV_PAGE_SPLIT |
10.27 |
2.62 |
19.41 |
51 |
523.79 |
|
INV_IMAGE_OCR |
19.91 |
4.01 |
59.86 |
102 |
2030.92 |
|
SMART_EXTRACT_PREPROCESSOR |
4.80 |
1.88 |
9.68 |
102 |
489.76 |
|
SMART_EXTRACT |
5.43 |
3.79 |
8.96 |
102 |
554.34 |
|
SMART_EXTRACT_POSTPROCESSOR |
2.96 |
0.60 |
8.38 |
102 |
302.16 |
|
SMART_EXTRACT_FOI |
14.27 |
1.03 |
38.61 |
102 |
1455.29 |
|
TRIGGER_PARALLEL_VESPA_SE |
5.86 |
1.80 |
18.19 |
102 |
597.85 |
|
INV_RESULT_AGGREGATE |
0.44 |
0.20 |
1.78 |
51 |
22.57 |
|
FINALIZE |
1.49 |
0.33 |
7.48 |
359 |
534.47 |
With PDF Search step
|
DU Steps |
Execution Time (Seconds) |
||||
|
AVG |
MIN |
MAX |
Occurrence per batch |
Extended Time per batch |
|
|
INITIALIZE |
1.85 |
0.38 |
5.51 |
155 |
286.64 |
|
VALIDATE |
1.01 |
0.20 |
3.62 |
155 |
156.47 |
|
ZIP_EXTRACT |
1.21 |
1.21 |
1.21 |
1 |
1.21 |
|
INV_DOC_SPLIT |
536.35 |
536.35 |
536.35 |
1 |
536.35 |
|
INV_PAGE_SPLIT |
3.14 |
0.88 |
7.88 |
51 |
159.92 |
|
INV_IMAGE_OCR |
23.63 |
3.72 |
97.73 |
102 |
2409.75 |
|
SMART_EXTRACT_PREPROCESSOR |
5.59 |
2.05 |
13.32 |
102 |
570.07 |
|
SMART_EXTRACT |
9.43 |
7.35 |
14.62 |
102 |
962.17 |
|
SMART_EXTRACT_POSTPROCESSOR |
3.32 |
0.56 |
17.62 |
102 |
338.45 |
|
SMART_EXTRACT_FOI |
16.29 |
1.19 |
46.76 |
102 |
1661.33 |
|
TRIGGER_PARALLEL_VESPA_SE |
7.14 |
2.05 |
21.64 |
102 |
728.52 |
|
INV_RESULT_AGGREGATE |
0.62 |
0.23 |
3.12 |
51 |
31.42 |
|
FINALIZE |
2.00 |
0.38 |
10.71 |
359 |
719.68 |
|
PDF_SEARCH |
9.45 |
1.30 |
44.58 |
102 |
964.09 |
In each steps of Document extraction in DU there is a Queue phase associated. The below table summarizes the time spent in the Queue of each of the steps of Document extraction in Document Understanding application.
Without PDF Search step
|
DU Steps |
Queue Time (Seconds) |
||||
|
AVG |
MIN |
MAX |
Occurrence per batch |
Extended Time per batch |
|
|
INITIALIZE |
2.80 |
0.57 |
8.00 |
155 |
434.32 |
|
VALIDATE |
3.00 |
0.68 |
10.13 |
155 |
465.61 |
|
ZIP_EXTRACT |
0.71 |
0.71 |
0.71 |
1 |
0.71 |
|
INV_DOC_SPLIT |
0.69 |
0.69 |
0.69 |
1 |
0.69 |
|
INV_PAGE_SPLIT |
2.54 |
0.65 |
5.91 |
51 |
129.36 |
|
INV_IMAGE_OCR |
204.00 |
0.76 |
673.37 |
102 |
20808.29 |
|
SMART_EXTRACT_PREPROCESSOR |
117.42 |
0.91 |
761.61 |
102 |
11977.33 |
|
SMART_EXTRACT |
1.74 |
0.59 |
5.87 |
102 |
177.69 |
|
SMART_EXTRACT_POSTPROCESSOR |
74.14 |
0.82 |
147.11 |
102 |
7562.56 |
|
SMART_EXTRACT_FOI |
140.59 |
0.85 |
813.30 |
102 |
14340.43 |
|
TRIGGER_PARALLEL_VESPA_SE |
2.19 |
0.68 |
9.13 |
102 |
223.05 |
|
INV_RESULT_AGGREGATE |
1.52 |
0.61 |
10.75 |
51 |
77.45 |
|
FINALIZE |
1.57 |
0.53 |
9.51 |
359 |
563.87 |
With PDF Search step
|
DU Steps |
Queue Time (Seconds) |
||||
|
AVG |
MIN |
MAX |
Occurrence per batch |
Extended Time per batch |
|
|
INITIALIZE |
3.52 |
0.65 |
12.63 |
155 |
545.65 |
|
VALIDATE |
3.71 |
0.82 |
14.36 |
155 |
574.29 |
|
ZIP_EXTRACT |
0.71 |
0.71 |
0.71 |
1 |
0.71 |
|
INV_DOC_SPLIT |
0.80 |
0.80 |
0.80 |
1 |
0.80 |
|
INV_PAGE_SPLIT |
623.66 |
99.51 |
1171.29 |
51 |
31806.70 |
|
INV_IMAGE_OCR |
200.58 |
0.98 |
725.64 |
102 |
20459.26 |
|
SMART_EXTRACT_PREPROCESSOR |
144.56 |
0.86 |
863.67 |
102 |
14745.54 |
|
SMART_EXTRACT |
3.67 |
0.68 |
12.24 |
102 |
374.48 |
|
SMART_EXTRACT_POSTPROCESSOR |
83.37 |
1.08 |
164.34 |
102 |
8503.77 |
|
SMART_EXTRACT_FOI |
137.72 |
0.86 |
872.63 |
102 |
14047.80 |
|
TRIGGER_PARALLEL_VESPA_SE |
2.83 |
0.82 |
9.69 |
102 |
288.91 |
|
INV_RESULT_AGGREGATE |
1.96 |
0.73 |
8.15 |
51 |
99.99 |
|
FINALIZE |
1.94 |
0.66 |
10.22 |
359 |
697.04 |
|
PDF_SEARCH |
6.06 |
0.68 |
51.26 |
102 |
617.96 |
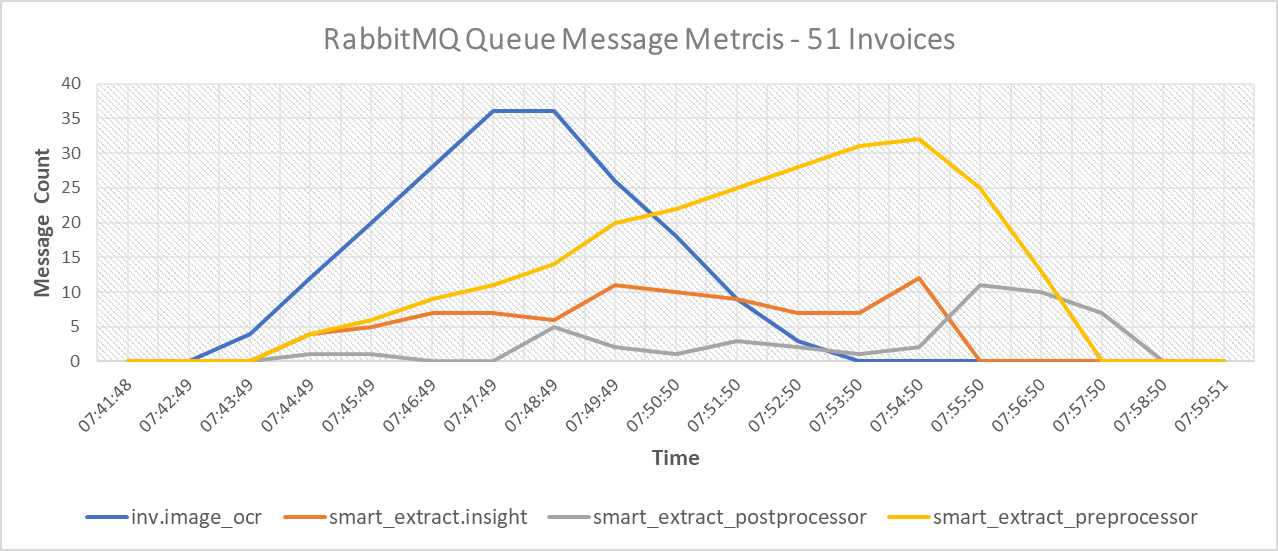
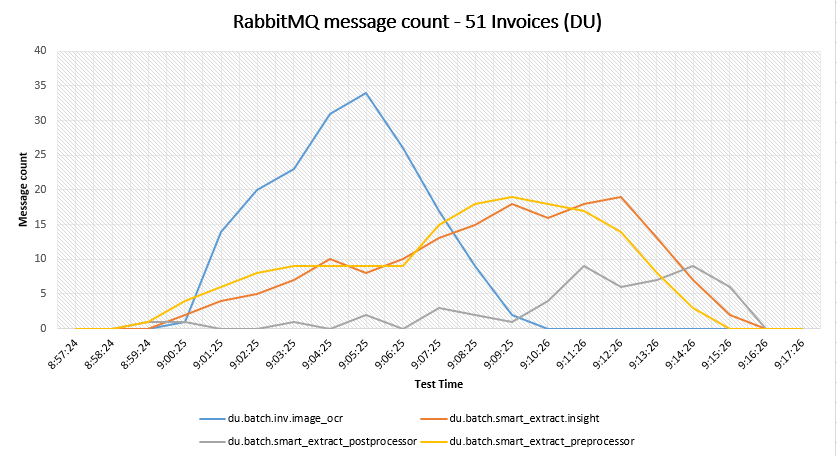
This involves metrics of messages in different Queues used by DU as part of the various steps of Documents processing by DU
It helps in identifying in which Queue the De-Queuing process is slow and helps to identify the component depending on the Queue which has a slow message exchange rate.
The below graph represents the count of messages in different queue used by each DU steps during test execution.
Without PDF Search step
With PDF Search step
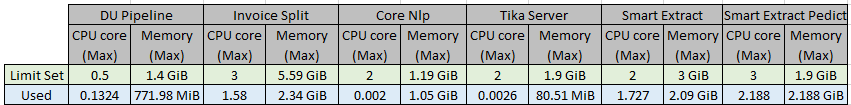
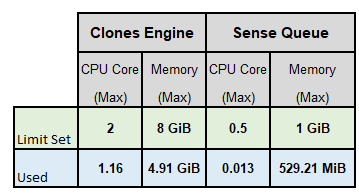
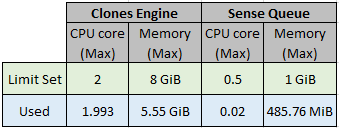
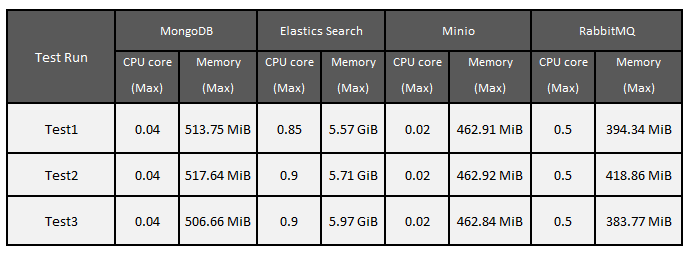
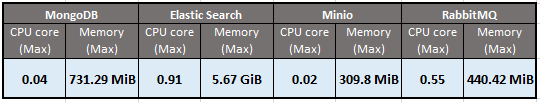
Below are the metrics captured on maximum CPU cores & Memory used while executing the performance test using the using sample invoices consisting of 51 invoices with 17 each sample of Low, medium, High complexity-based invoices of different vendors.
As part of ensuring high availability 2 POD of each components are deployed in Kubernetes, the CPU core and Memory shown below is the maximum CPU cores & memory usage of both the POD of each core component of Document Understanding, Clones, Database, Message Broker using the Smart Extract documents processing engine.
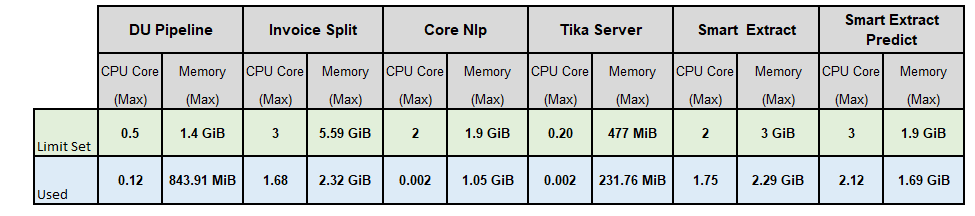
With PDF Search step
Without PDF Search step
With PDF Search step
Without PDF Search step
With PDF Search step
Raw data of each test executions from Document Understanding are available on the following SharePoint location - Test Run Data
For the complete processing of 51 invoices, an addition of 3 minutes is consumed at DU compared with tests conducted before the PDF search code implementation.
PDF search step took an average of 9.45 seconds and a max of 44.58 seconds for each page in the invoice document.
The time taken to process the invoices for Smart Extract exclusive & just Smart Extract pipeline enabled in the combined environment is observed to be similar.
The time taken to process the invoices for Smart Extract exclusive & just Smart Extract pipeline enabled in the combined environment is observed to be similar.
The time taken to process the invoices for Smart Extract exclusive & just Smart Extract pipeline enabled in the combined environment is observed to be similar.