ITOps v7.0.0-Release Description
Contents
- Introduction of ITOPs Package Workflow
- ITOPs Alert Console Implementation
- Implementation of Alert Listing Page
- Assigning an alert and associated ticket to logged in user
- Ability to mark an alert as "acknowledged" based on organisational policy
- Ability to create and save alerts filters
- Move alerts in a cluster to new one by creating a new ticket from Alert Listing
- Ability to Close and Hold Alerts
- Ability to close (resolve) a ticketed Cluster
- ServiceNow Integration
- Dashboard Features
- Network Topology/Infrastructure
- Alert Correlation Policy
- Alert Acknowledgement Policy
- Recovery Policy
- Auto closure and Flapping Configuration
Introduction of ITOPs Package Workflow
ITOPs Package Workflow aims to provide enterprises a centralized mechanism to manage their infrastructure and applications. ITOPs PWF gives a single pane of glass view to other monitoring tools customer uses, the capabilities helps organisations:
-
Effective management of Alerts with alert correlation
-
Dashboard and Alert console giving engineers a comprehensive view of events and alerts from various tools
-
Configurations and rules to effectively manage tickets
Enable personas - ITOPs Engineer, ITOPs Administrator, Installation Engineer
ITOPs is enabled with following personas:
-
Installation Engineer
-
ITOPs Administrator
-
ITOPs Engineer
-
Customer Visitor
ITOPs Alert Console Implementation
Alert Console in ITOPs is the area within the application which displays alerts and provides functionalities to act on the alerts.
Alert Console has:
-
Alert List
-
Alert List Productivity Features
-
Alert Filter
-
SLA Indicator
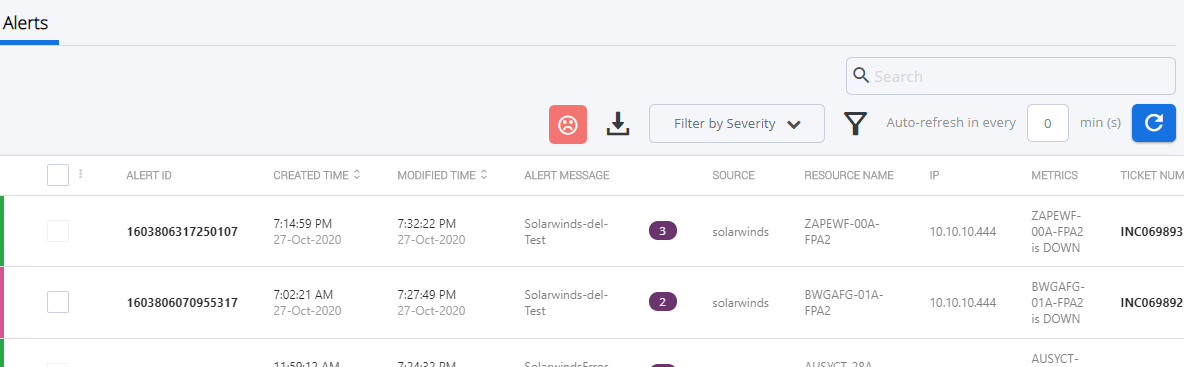
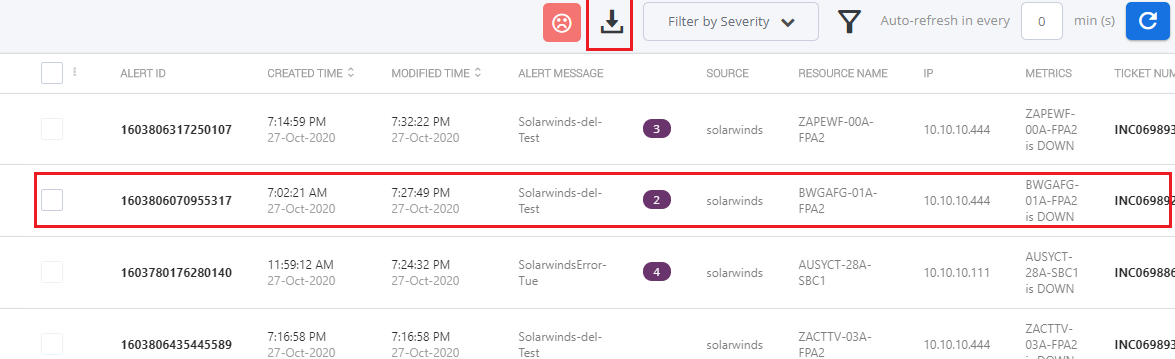
Implementation of Alert Listing Page
Alert Listing page enables the ITOPs administrator / ITOPs engineer to view the alerts generated and act on the alerts. Alert Listing page includes:
Basic Details related to Alerts
Basic details such as Alert ID, Created Time, Modified Time, Alert Message, Source, Resource Name, IP, Metrics, Ticket Number, Elapsed Time, and State/Action.
Users can see additional details by clicking on ‘…’ against the record.
Severity of Alerts
ITOPs PWF enables to visually identify the severity of alerts in Alert Listing so that user can quickly identify the alerts that needs urgent attention. Severity of alerts is identified as follows:
-
Ok – Green
-
Warning – Orange
-
Information – Blue
-
Major – Magenta
-
Minor - Purple
-
Critical – Red
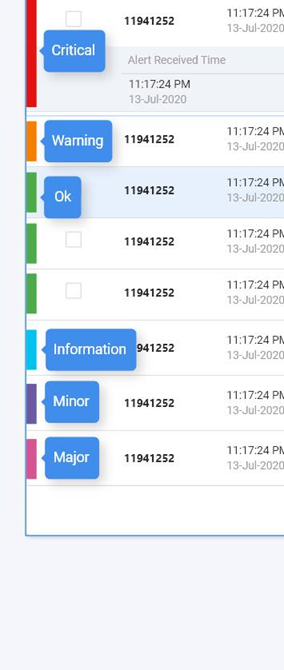
When a new alert is received and correlated with an existing alert cluster, the severity indication strip displays the colour of latest alert's severity.
Sort by Severity
Alerts available in the Alert listing page can be filtered based on severity of the alert.

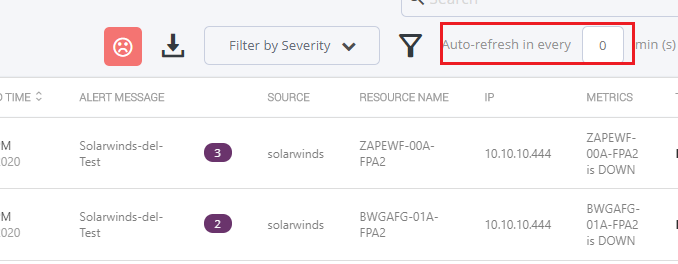
Refresh/Auto Refresh feature
An ITOPs Administrator or ITOPs engineer is enabled with the feature to specify the refresh interval of alert listing page so that the list page displays latest information.
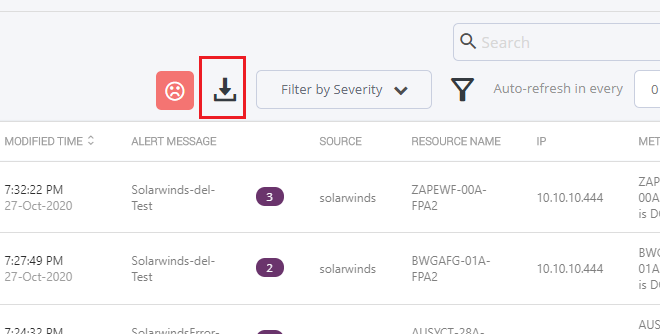
Facility to download alerts
An ITOPs Administrator or ITOPs engineer is enabled with the capability to download alerts as .CSV file.
Facility to handle display of correlated alerts as a single line item
Alert Listing page displays all correlated alerts as a single line item, so that the user can monitor the infrastructure effectively.
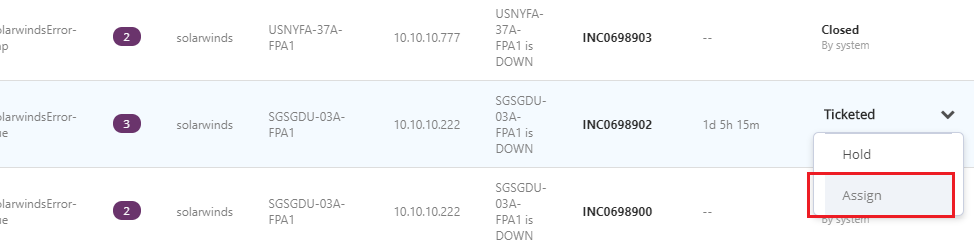
Assigning an alert and associated ticket to logged in user
ITOPs PWF enables the users to view all the alerts and also provides the capability to assign to self (logged in user). In addition, user may assign to other users or groups as per requirement.
Ability to mark an alert as "acknowledged" based on organisational policy
ITOPs PWF provides the capability to define acknowledgement policies for alerts for which ticket need not be generated. In such cases, user can mark the alert as "Acknowledged". based on organisation policy.
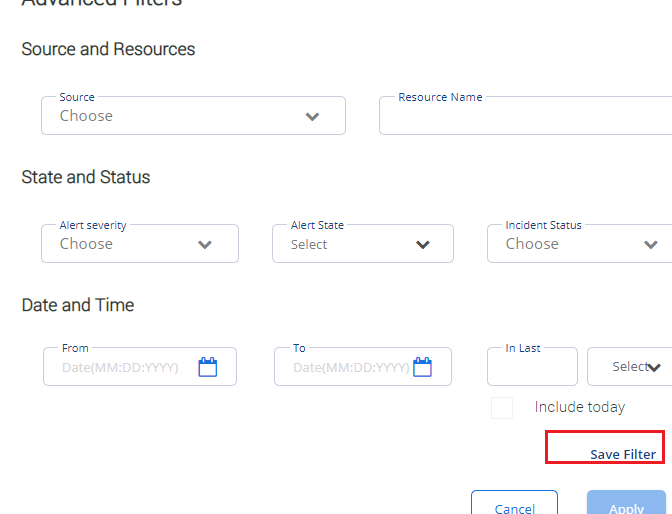
Ability to create and save alerts filters
Alert Console provides an Advanced Filter capability to filter the alerts based on predefined criterias. The criterias / filters (regulary used) can be saved, as per requirement.
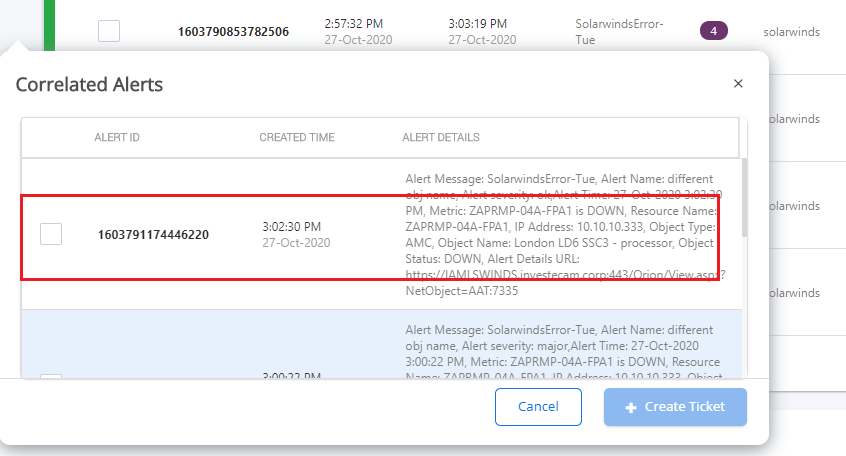
Move alerts in a cluster to new one by creating a new ticket from Alert Listing
ITOPs PWF provides the capability to create cluster of alerts based on certain policies. But if the users feel that some of the alerts in the cluster must be moved to a new cluster, they can do so by selecting them from the alert cluster pop over and clicking the ‘Create Ticket’ button.
This feature also allows users to create ticket to a non-ticketed cluster (Acknowledgement)
Ability to Close and Hold Alerts
Alert Console provides the capability to view the list of alerts. This also provides the capability to close or hold alerts, in addition to assign option.
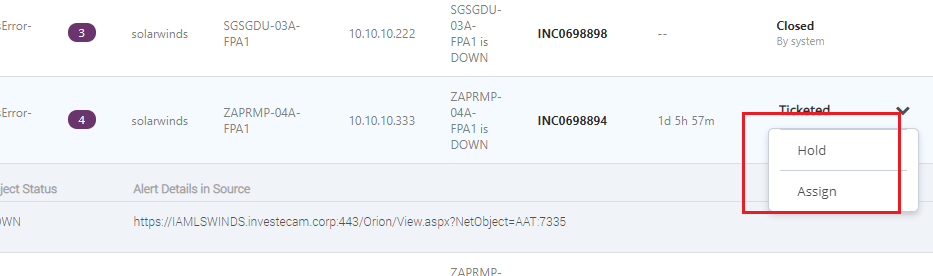
Ability to close (resolve) a ticketed Cluster
Alert Console also provides the capability to close a cluster of tickets. The PWF also enables to:
-
Ability to move a ticket associated with a cluster to 'Hold' status
-
Ability to move more than on alert cluster to 'Hold' Status
-
Ability to move more than one alert cluster to 'Close' Status
ServiceNow Integration
Services Now is integrated with SmartOps which enables to view and act on Service Now tickets.
Interface to view ServiceNow ticket details
ITOPs PWF provides an interface to view the service now tickets.
Ability to act on ServiceNow tickets
ITOPs PWF is integrated with Service Now, and Service now tickets can be assigned to a team member or a group.
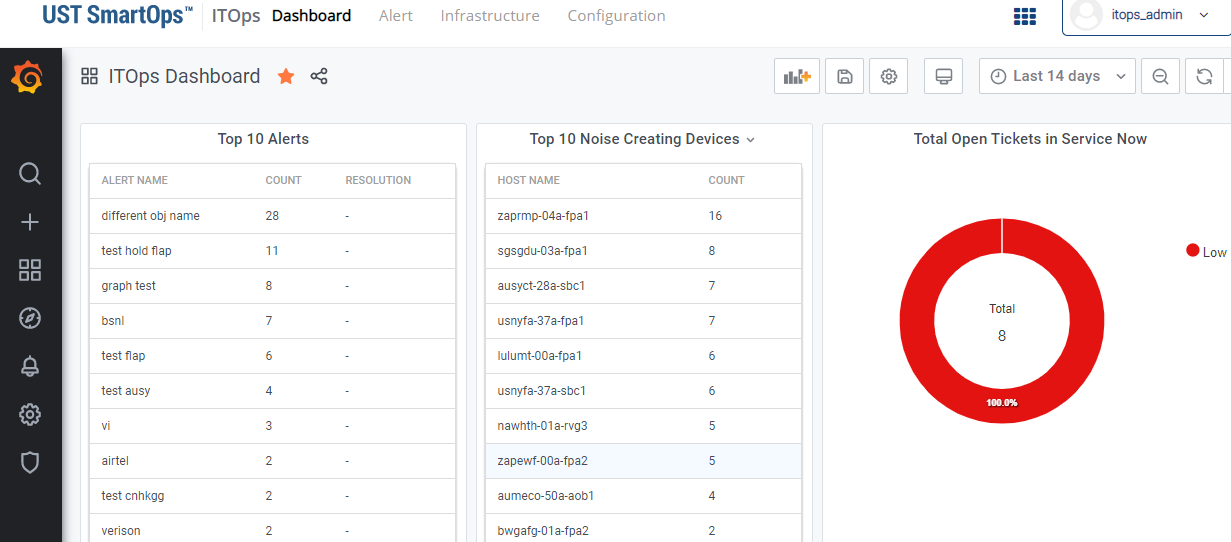
Dashboard Features
Dashboard is the section in ITOPs where various widgets is displayed for the ITOPs Engineer. This dashboard is powered using Grafana.
Dashboard consists of the following widgets:
-
Top Alerts
-
Top Noise Creating Devices
-
Total Number of Open Tickets in Service Now
-
Open vs Closed Alerts
-
Alert Trend
-
Resolution SLA
-
Alert Pattern
-
Source Device Mapping
Network Topology/Infrastructure
ITOPS PWF is enhanced to manage the network topology feature.
ITOPs administrator is enabled to import a network topology using the import section so that SmartOps can use it for correlation of alerts.
Topology data is moved from Grakn to Elastic Search.
This feature is available only thriuh API. It is also possible to import device inventory via API.
Alert Correlation Policy
Alert Correlation policy defines how alerts should be correlated. Alert Correlation policy enables to cluster related alers together. All the alerts within a cluster will be mapped to a single ticket.
It also allows users to specify:
-
Whether to consider topology while correlating alert
-
Similarity checking rules
Alert Correlation feature enables to:
-
Create New Alert Correlation Policy for ITOPs Admin users.
-
View Alert Policies for ITOPs engineer users.
-
Edit/Delete Correlation Policies.
Alert Acknowledgement Policy
Acknowledgement policy decides on which all conditions, auto ticketing should be skipped. Certain scenarios may have the requirement to skip the ticket creation for certain alerts. ITOPs PWF provides the capability to define acknowledgement policies.
Recovery Policy
This feature is available only via API.
Allows policies to be set on how they system can identify a recovery condition from the received alerts.
Auto closure and Flapping Configuration
This feature is available only via API.
Auto closure and Flapping configuration allows to specify how the clusters can be closed when they receive a recovery alert (based on recovery policy).