ITOps v1.4-Performance Test Report
Contents
- Overview
- Performance Testing – Workload Parameters
- Test Environment - Infrastructure setup
- Performance Testing - Software Used
- Performance Testing – ITOps components & Replicas
- Performance Test Approach
- Performance Test -Summary
- Performance Metrics Captured
- Alert Surge Metrics
- Alert Correlation Time
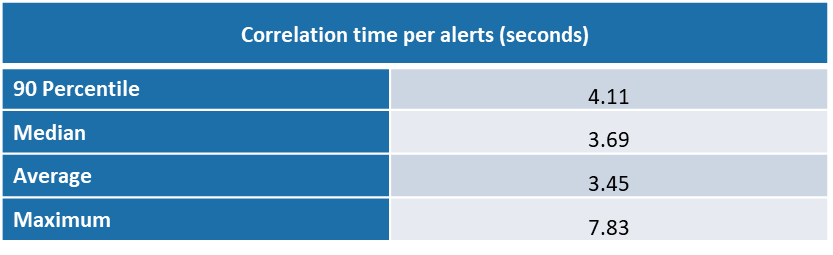
- Time taken for correlation of each alerts is 4.11 seconds (p90) and median time is 3.69 seconds
- IHub Alert Processing Time
- Median time taken by iHub in processing each alert received in different batch is 0.06 seconds
- Clones Workflow Execution Time
- Performance Test – Infrastructure Resource Usage
- Clones Engine
- Other application components
- Clones Sense Queue
- iHub Component
- iHub Services
- Alert Correlation
- Alert Mapping
- Databases & Message Broker
- POD Autoscaling metrics
- Performance test Observations & Recommendations
- Performance test metrics comparison- ITOps 1.4 & 1.3
- Infrastructure Cost
- Performance test Execution results
Overview
SmartOps ITOps manages alerts and notifications from multiple monitoring agents for an organization.
It supports automatic creation of Service Now tickets against alerts and provides intelligent root-cause suggestions by correlating with existing open tickets. It avoids creation of duplicate tickets by identifying similar open tickets or root tickets based on the dependency topology.
ITOps 1.4 introduces a new feature to detect surge of alerts wherein there are instances were there can be unexpected dump of huge volume of false alerts, may be due to some maintenance activity carried in some network sites or locations. This result in a sudden increase in alerts being propagated from the monitoring tools.
Alert Surge monitoring feature of ITOps segregate surge alerts and proper alerts received from monitoring tools. Surge alerts are identified based on a pattern and are grouped into a separate cluster and monitored separately, this helps in avoiding this surge based false alerts for further processing. At the same time proper alerts received will be processed by ITOps.
Performance Testing – Workload Parameters
The following parameter define the workload of Alert Surge based performance testing of ITOps using Queue channel.
|
|
|
|
SYSTEM WORKLOAD PARAMTERS |
|
|
|
|
|
Total sample Alerts |
13370 |
|
Test Duration |
5 hrs |
|
Monitoring Agent type |
SolarWinds |
|
Surge Alert Pattern |
NODE & SITE BASED |
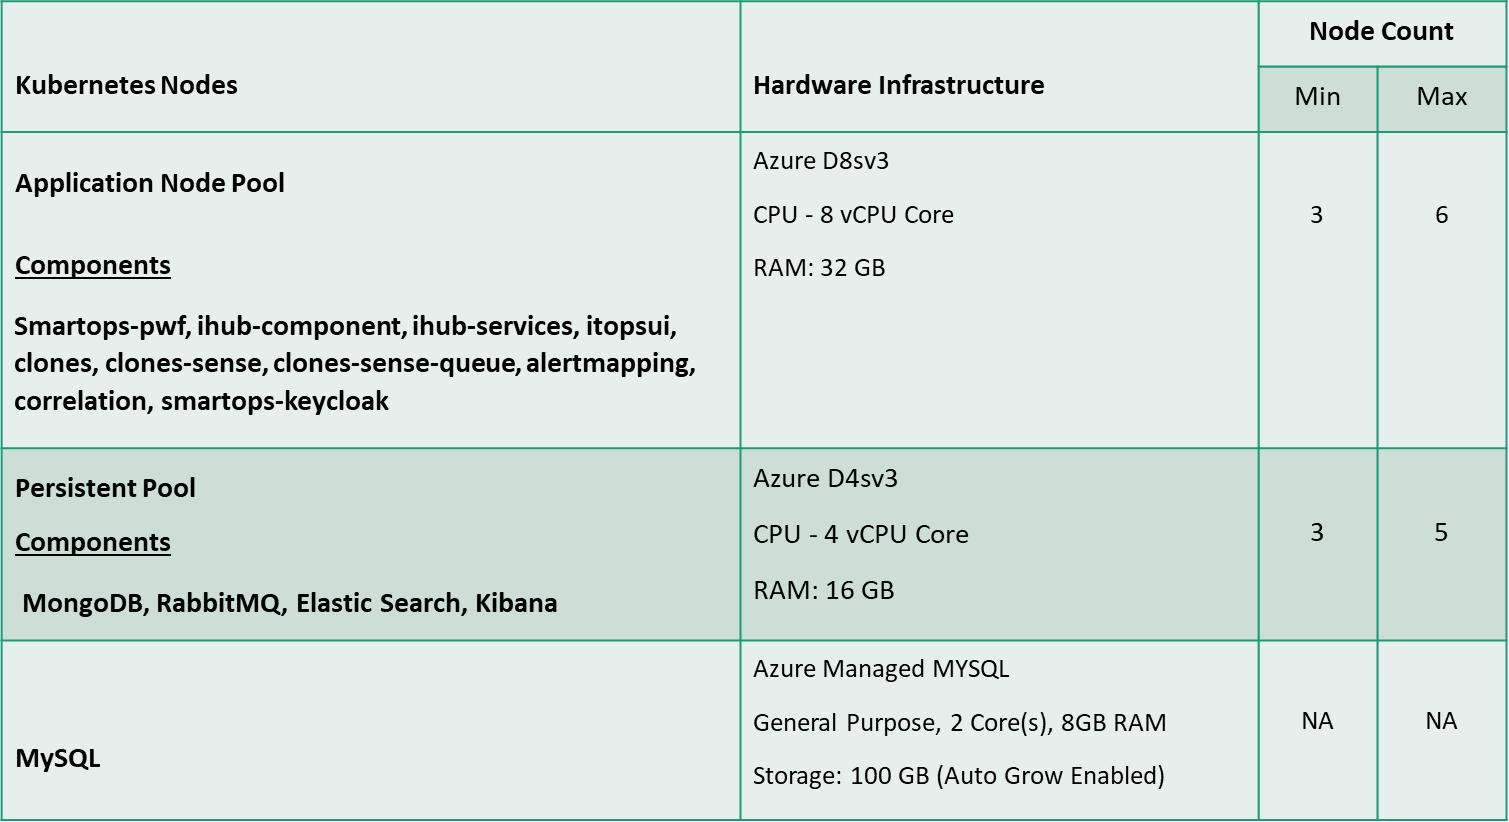
Test Environment - Infrastructure setup
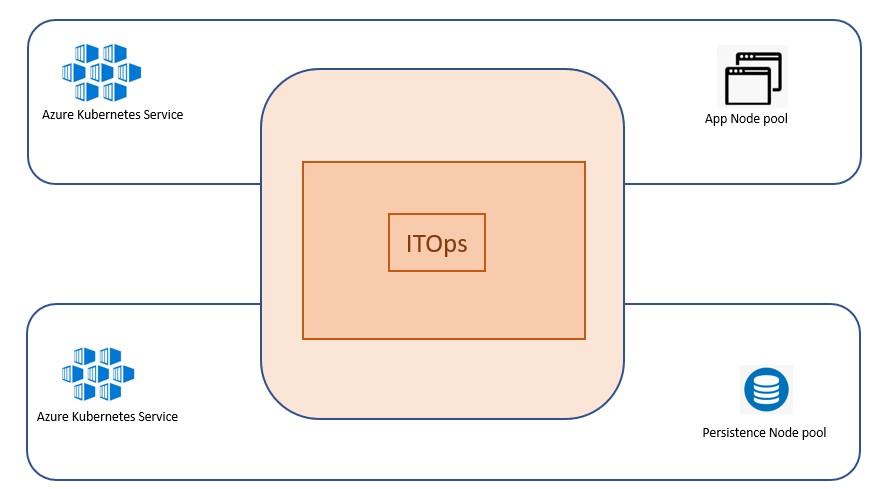
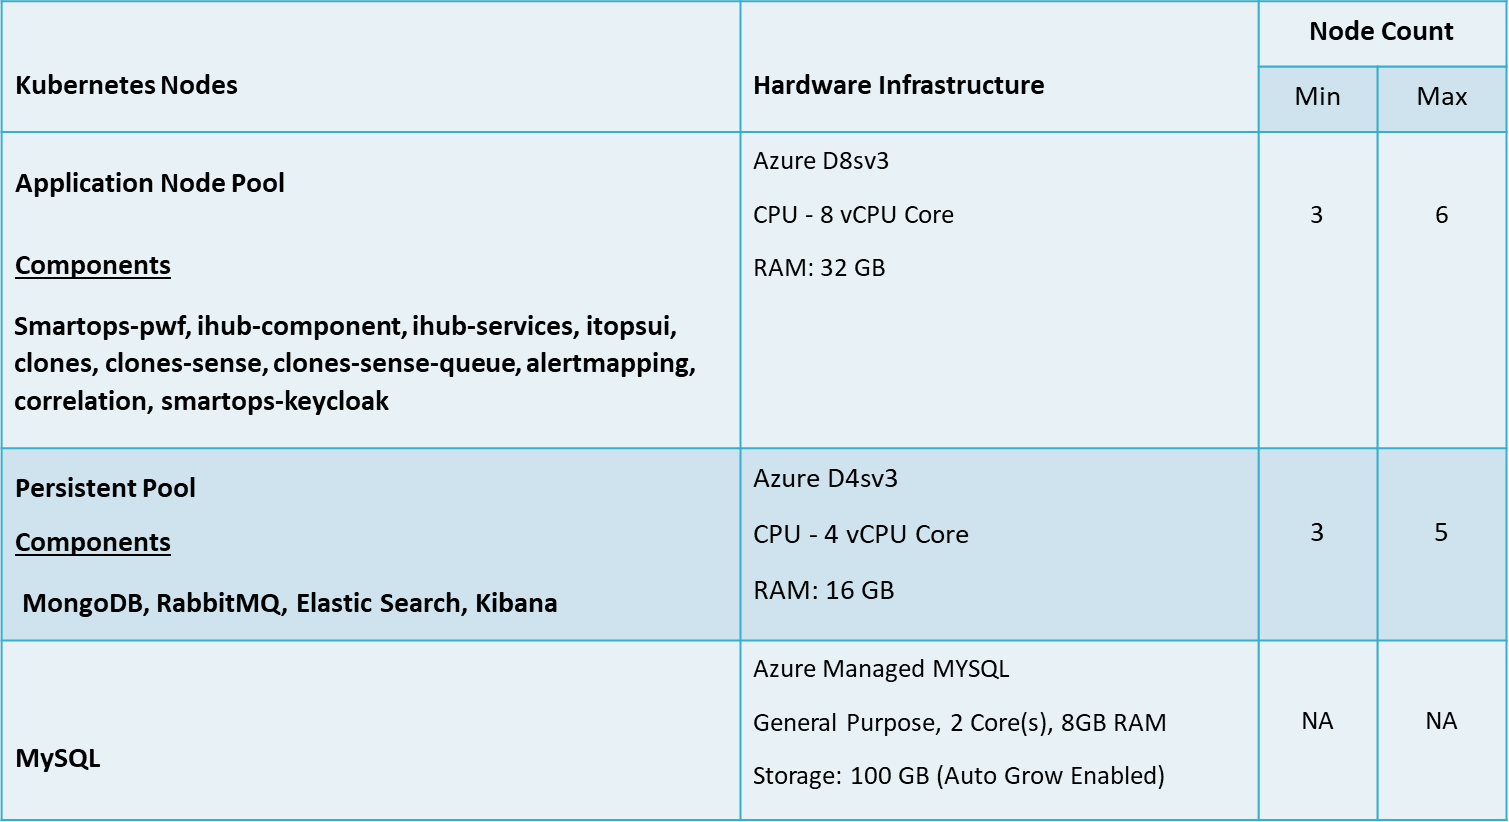
ITOps components, IHub, Clones, Databases & Message Broker are hosted in Kubernetes environment in Azure cloud.
Performance Testing is conducted with the following configuration of Kubernetes Cluster hosted in Azure. The Kubernetes ITOps cluster comprises of 2 different types of node pools such as Application Node Pool, Persistent Node Pool.
MYSQL is hosted as a Azure Managed Service.
The below table summarizes the hardware configuration & Number of VM & components hosted in each Node Pools.
Performance test environment setup
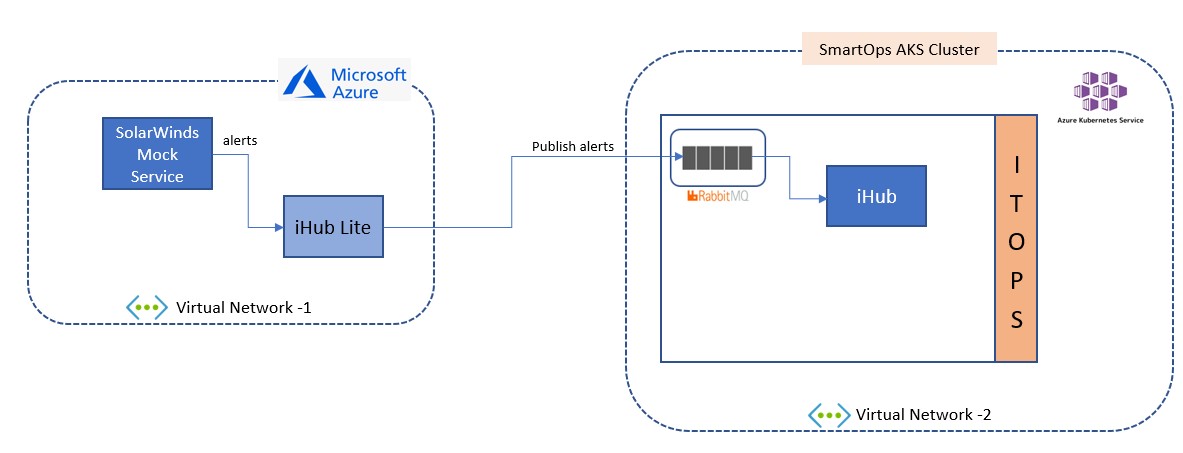
To replicate a production-based Infrastructure environment IHub Lite & SolarWinds based mock service are hosted in an Azure VM hosted at Azure cloud in a different virtual network.
IHub main along with ITOps components are hosted at Kubernetes environment in Azure cloud in another virtual network.
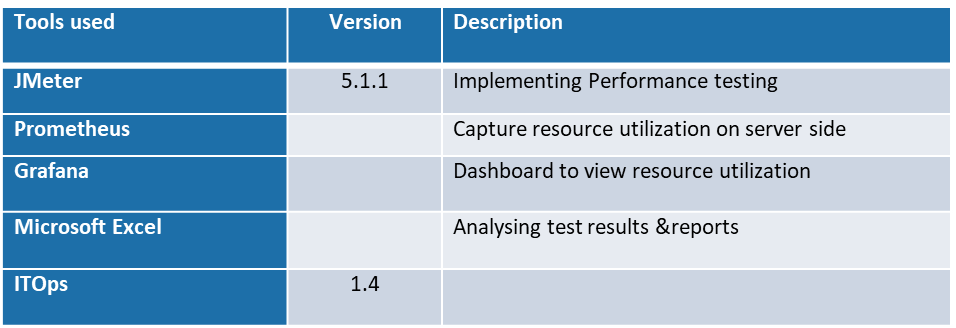
Performance Testing - Software Used
Following Tools used as part of performance testing
Performance Testing – ITOps components & Replicas
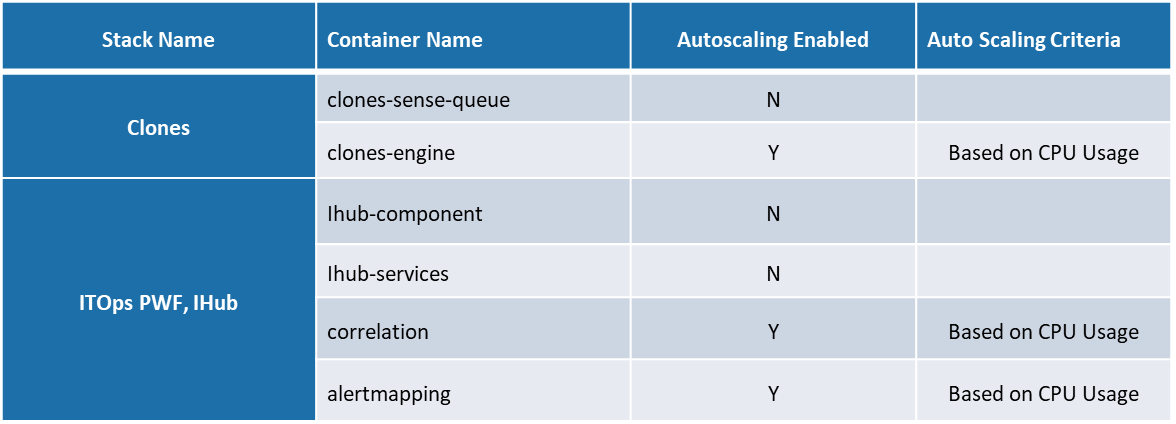
The below table provides details of docker containers of different components associated with ITOps such as Clones, ITOps components, Clones, iHub, Database & Message Broker.
This also provides detail of components identified for Autoscaling and the criteria defined for Autoscaling. As part of ensuring availability of non-scalable components to avoid failures of any components during document processing, 2 instances of each components are by default available in the Kubernetes cluster.
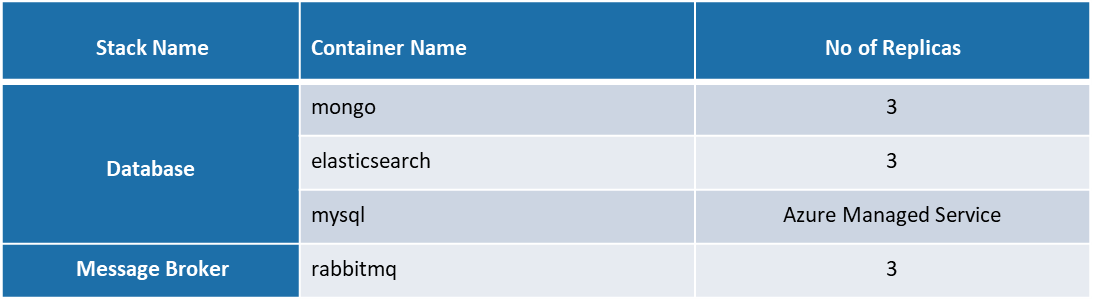
Following are the details of replicas configured for Database & Message Broker in Kubernetes cluster MySQL is deployed as a Managed service at Azure.
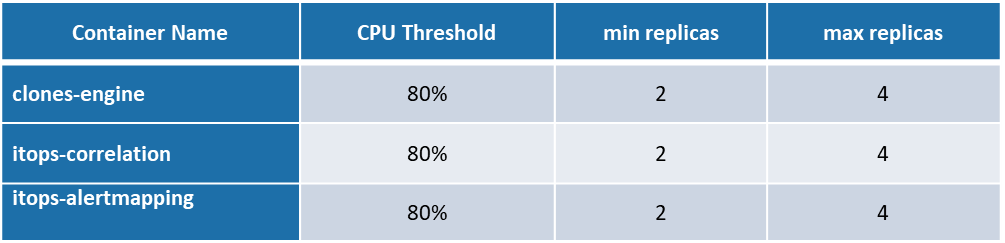
Autoscaling Configurations
Following are the CPU threshold limits, Replicas (Minimum & Maximum) configured for each component identified for Autoscaling in Kubernetes cluster for ITOps.
Performance Test Approach
Performance Testing of ITOps is conducted by sending system alerts & notifications captured by SolarWinds monitoring agent. A SolarWinds monitoring agent based mock service is created to simulate different types of System alerts such as UP, DOWN, Warning, Critical alerts & notifications alerts are simulated by the mock service.
This service is polled continuously by IHub Lite API scanner channel in a fixed interval and the polled data is pushed to ITOps Queue system from which the alerts are processed further by IHub main & ITOps. SolarWinds based mock service simulates alerts archived from a production-based system.
Alert surge-based testing is one of the core objectives of this Performance test, Mock service can generate surge-based alerts belong to a particular node. The volume of alert simulated as part of Alert surge from mock service is configurable, so any random volume of alerts can be simulated based on different test scenarios.
Test is conducted by simulating different counts of system alerts by mock service in a specific interval at different alert times. This helps in creating system alerts workload like a production-based environment.
This test helps us to capture the metrics on when an alert surge is detected as well as when an alert surge ended , It also identifies the throughput of alerts that is successfully processed by ITOps and the time taken in correlation of related alerts.
Performance Test -Summary
Performance Testing on Alert Surge was conducted on ITOps by sending SolarWinds based alerts samples simulated from a SolarWinds mock service continuously for a longer duration.
To simulate the alert surge pattern like a production system, surge-based alerts in high volumes are infused along with normal alerts from the mock service for a random duration. This helps in creating a test scenario where higher volume of alerts reaches ITOps for processing.
This high-volume alert infused in random intervals help us to capture the performance metrics of ITOps in detecting the alert surge and further processing including the normal alerts.
IHub lite API scanner channel polls the mock service continuously in an interval of 1 minute and IHub lite channel publishes the alerts to ITOps Queue from which further processing of alerts starts.
This test report is prepared based on the metrics collected from the last test execution conducted using test data archived from a production system.
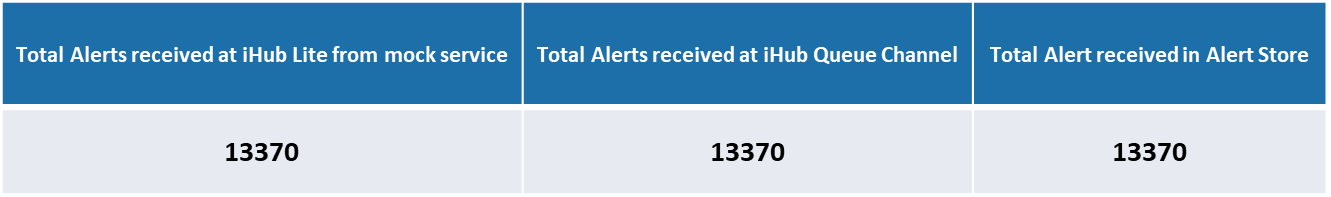
Following are the counts of alerts received at IHub Lite, IHub Queue channel & Alert store. There was no missing of alerts observed in the test execution.
Performance Metrics Captured
Alert Surge Metrics
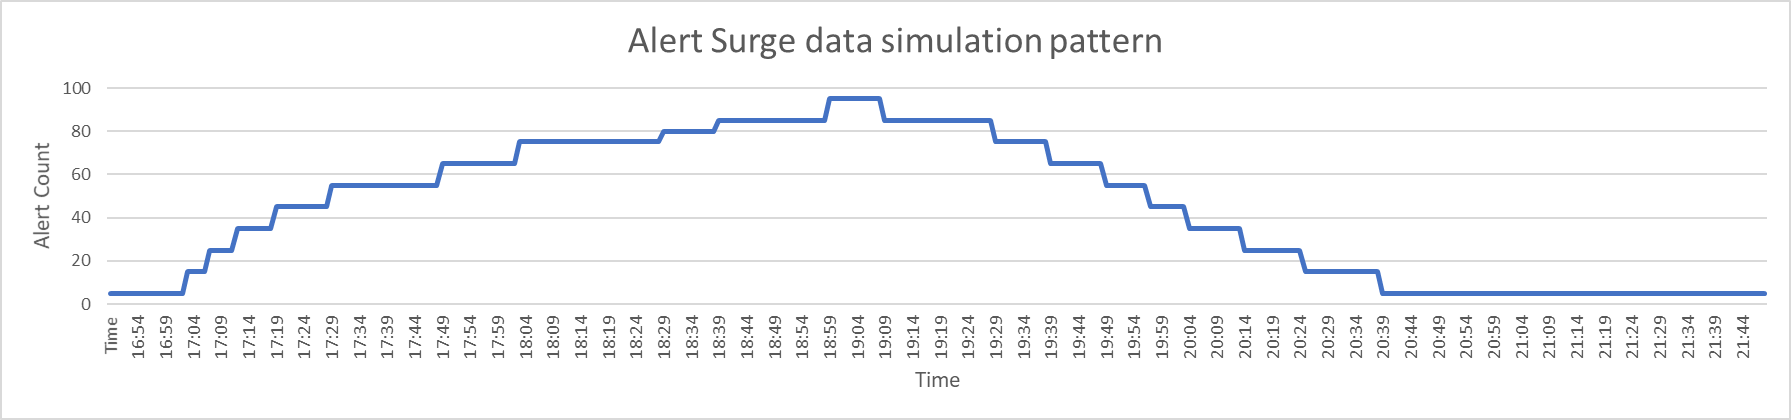
Alert surge-based testing was conducted by simulating different volumes of false alerts in random durations along with the normal alerts, the below diagram shows the pattern in which data was simulated from the mock service during the test execution.
The following alert simulation workload would help us in capturing the performance metrics of ITOps in detecting the alert surge based on the Node & site based alert surge detection pattern.
Following are the alert surge configurations used for the surge start & surge end detection.
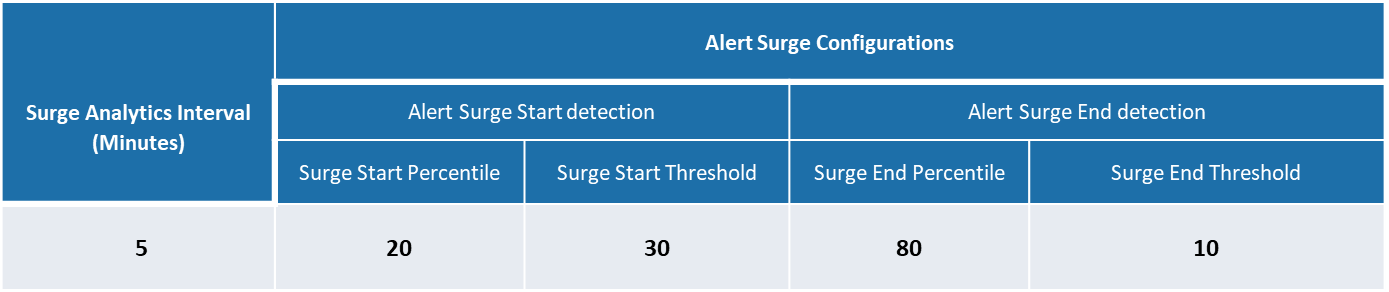
Based on the above shown alert surge infusing pattern from SolarWinds mock service and alert surge configuration , following are the volume of alerts captured by the ITOps Alert Analytics for the detection of the start of alert surge and as well as the end of surge.
Alert Analytics Scheduler is configured to run every 1 minute, and the Alert Surge Analytics is configured to process all the new alerts received in a duration of 5 minutes.
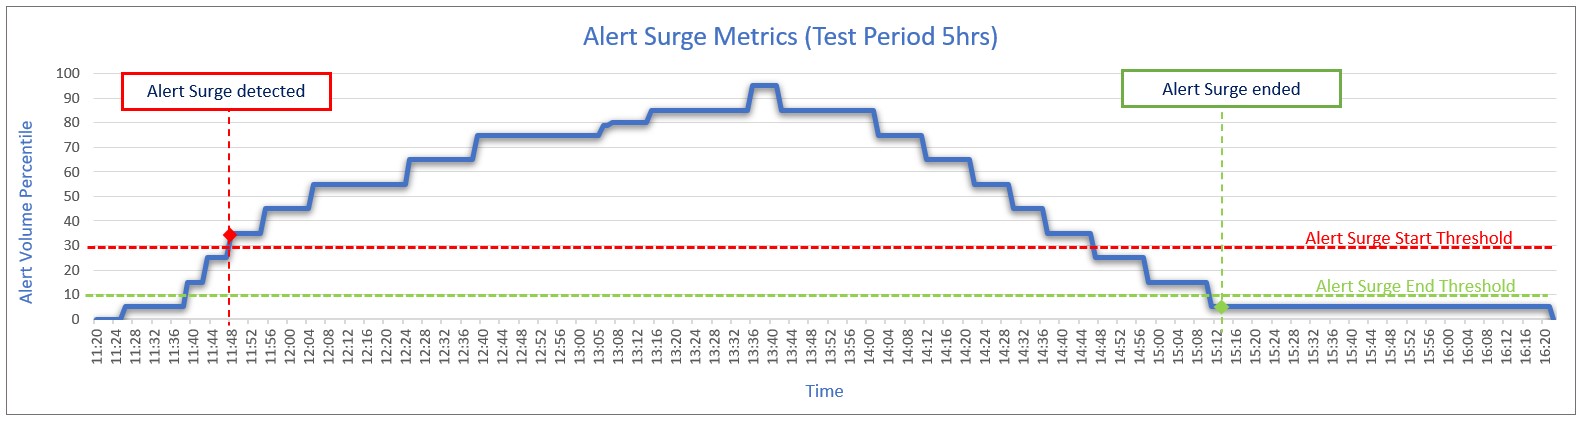
Following graph shows the point at which alert surge start and end is detected by ITOps during the test execution.
Alert Correlation Time
To capture the time taken for the correlation of similar and related alerts, the test is conducted by simulating fixed count of normal alerts every minute along with different count of high-volume surgebased alerts infused by the mock service. This type of varying alert simulation pattern helps us in capturing the performance metrics on alert correlation in scenarios when a surge of false alerts in high volume is received at ITOps system.
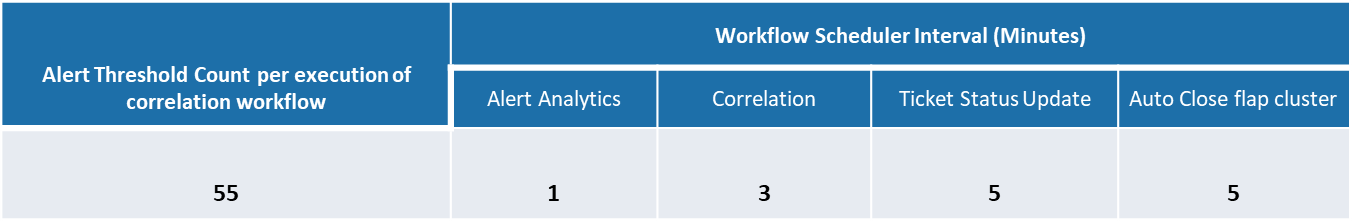
Following are the threshold count of alerts set for correlation workflow and the duration of the schedulers for Correlation, Ticket status Update & Auto closure flap cluster.
Alert Threshold count per execution of workflow represents the count of alerts taken by correlation workflow during each execution of the workflow as part of alert correlation.
There were 1840 alerts correlated out of the total 13370 alerts received inclusive of the surge-based alerts
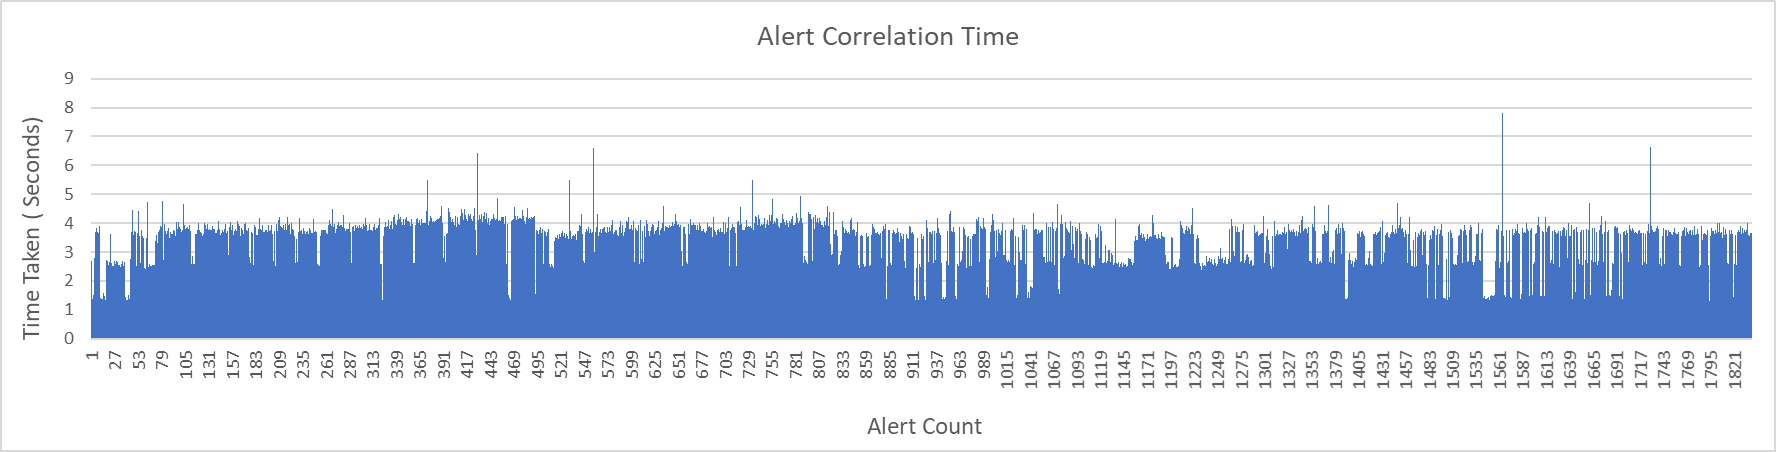
Following are the time taken for alert correlation during the test executions conducted with above mentioned configuration of alert threshold and workflow scheduler time.
Time taken for correlation of each alerts is 4.11 seconds (p90) and median time is 3.69 seconds
Following is the graphical representaion of time taken for correation of each alerts.
IHub Alert Processing Time
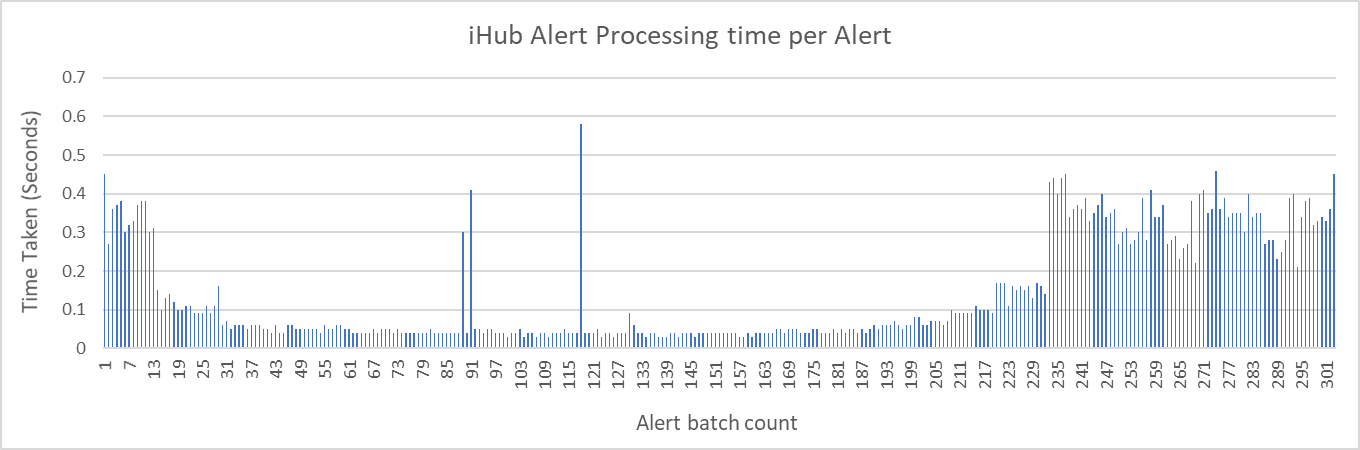
The following graph shows the time taken in the processing of alerts in IHub. This also involves the time taken in the transformation of alerts received from IHub Lite channel to SmartOps Platform message format.
Alerts are received as batches each time when iHub main polls the ITOps Queue with each batch having different counts of alerts simulated from SolarWinds mock service.
Median time taken by iHub in processing each alert received in different batch is 0.06 seconds
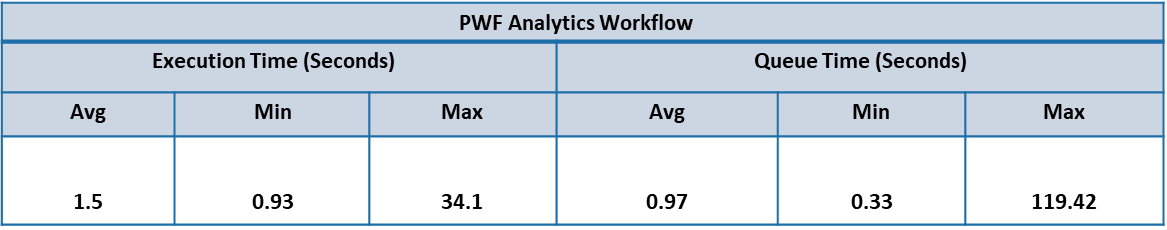
Clones Workflow Execution Time
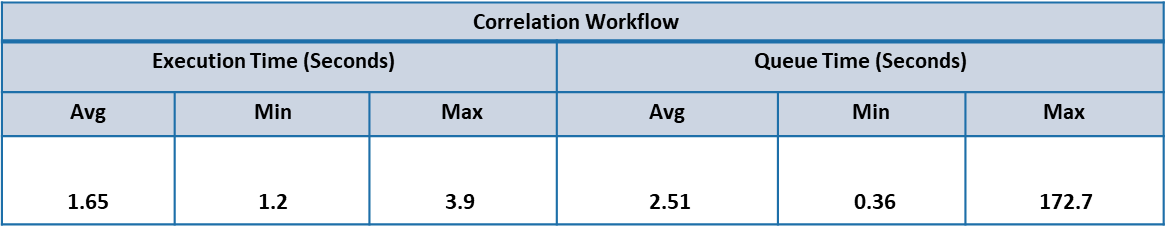
This captures the time taken (Queue & Execution time) for the execution of workflows such as Correlation, PWF Analytics, Ticket update Scheduler & Auto close flap cluster by clones engine as part of processing different system alerts.
Each workflow has different steps of micro actions and there is a Queue phase & Execution phase involved in each of steps.
Below table summarizes the Average, Min, Max time taken in Queue & Execution phase involved in each step associated with a workflow during the test execution.
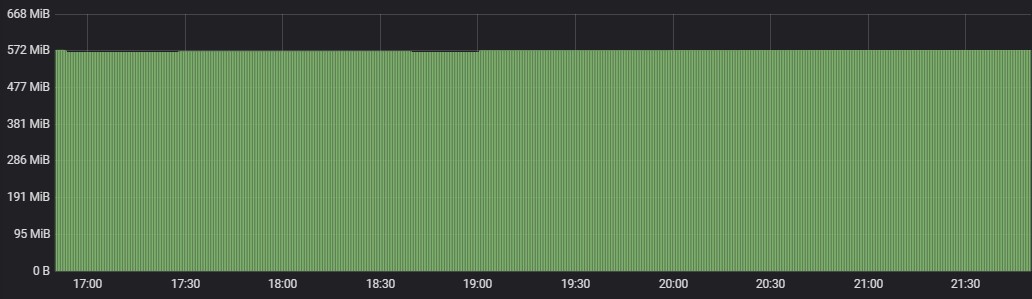
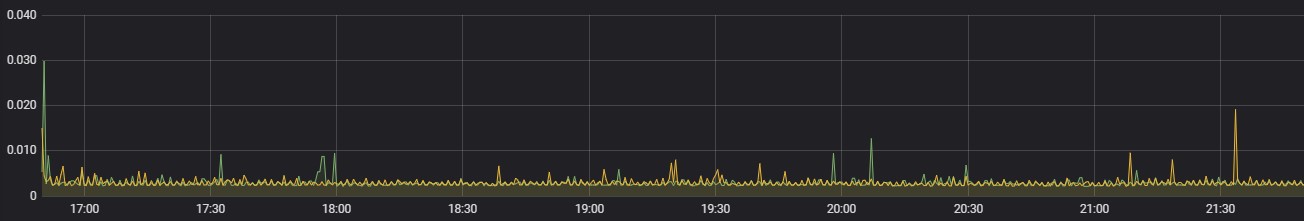
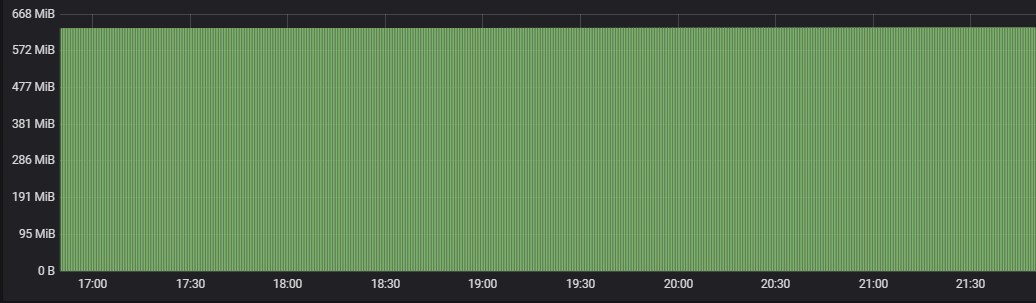
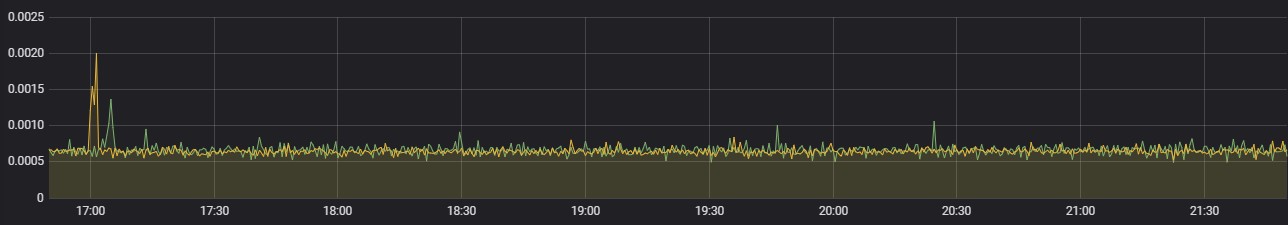
Performance Test – Infrastructure Resource Usage
Following are the CPU & Memory usage of various components in ITOps during the test executions.
Application components
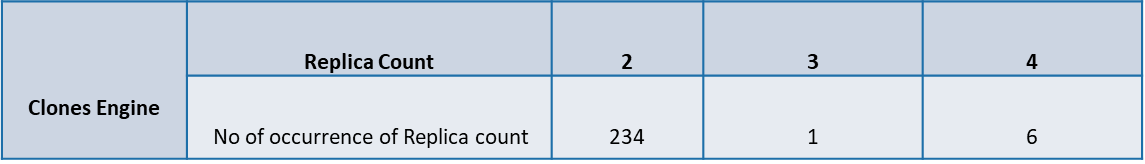
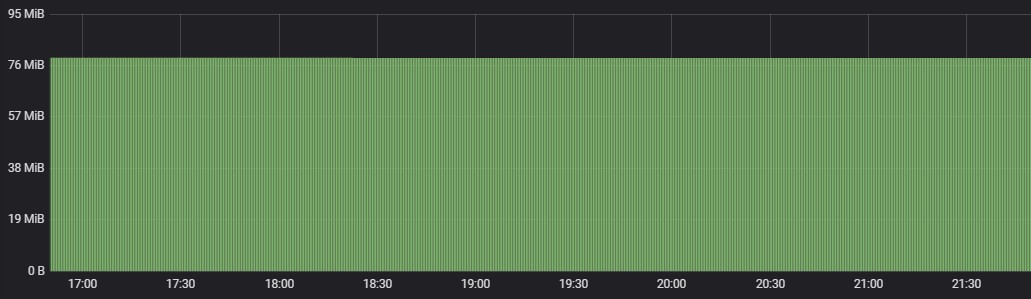
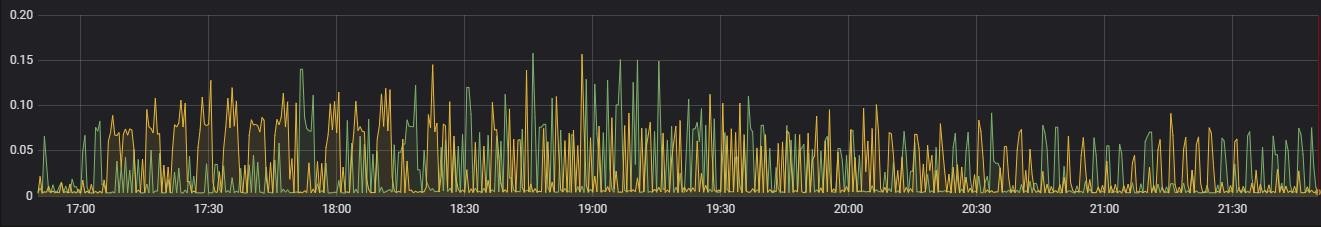
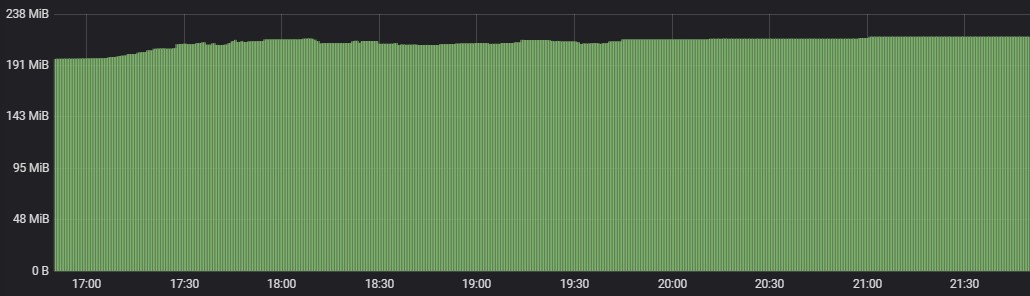
Clones Engine
Its observed during test execution that CPU usage in POD’s reached above threshold limit at certain instances and as a result autoscaling of clones engine got initiated.
The max CPU usage had reached up to 1.60 core in one of the POD and max memory usage reached up to 4.96 GiB during the test execution in one of the PODS.
Following is the summary of the of occurrence of the POD replica count in clones engine during the test execution.
POD Replica usage pattern of clones engine during test execution is as follows
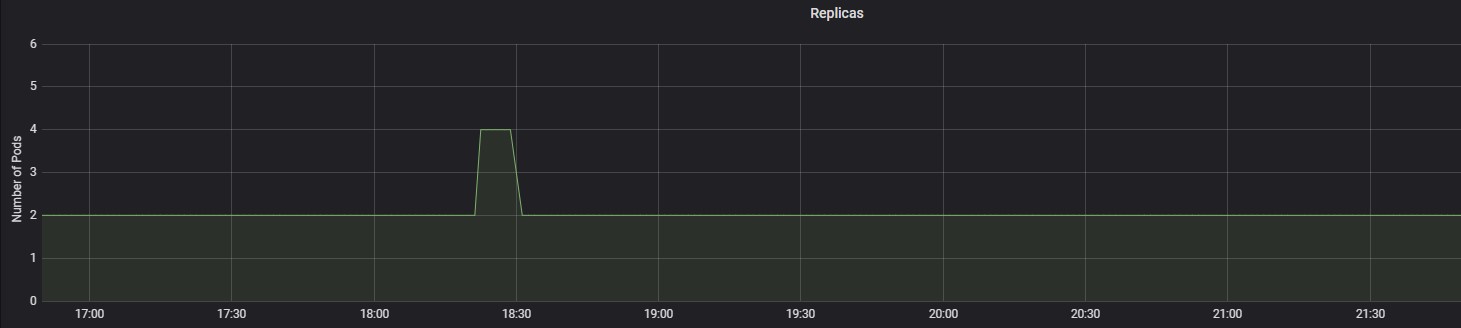
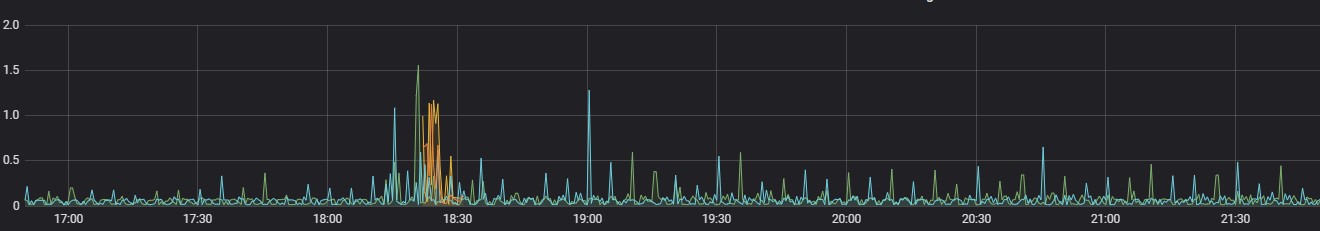
Followings are the graphical representation of CPU usage of multiple POD’s of clones engine during the test execution.
Other application components
The following tables shows the max CPU & Memory usage of other application components of ITOps.
Even though Auto scaling was enabled in alert correlation & alert mapping component the replica count of both components remained as 2 throughout the test execution.
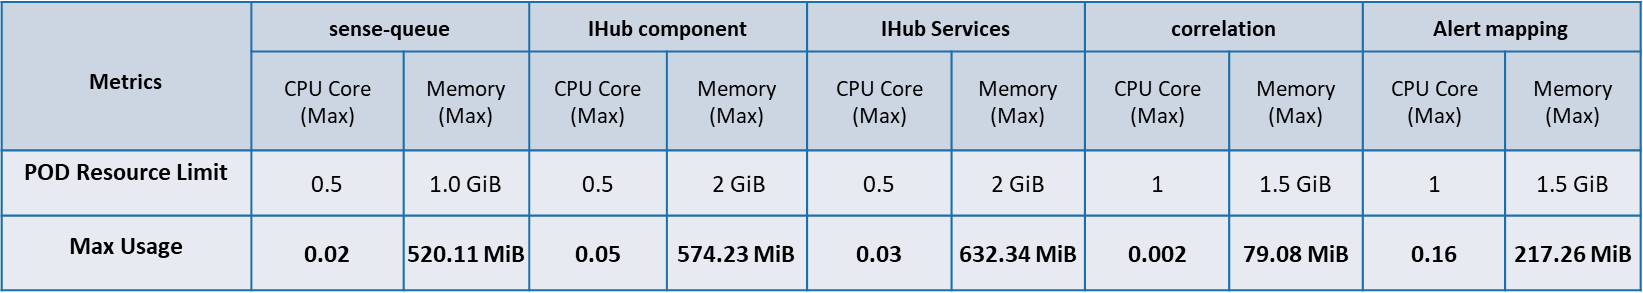
Following are the CPU & Memory usage of other application components in ITOPs
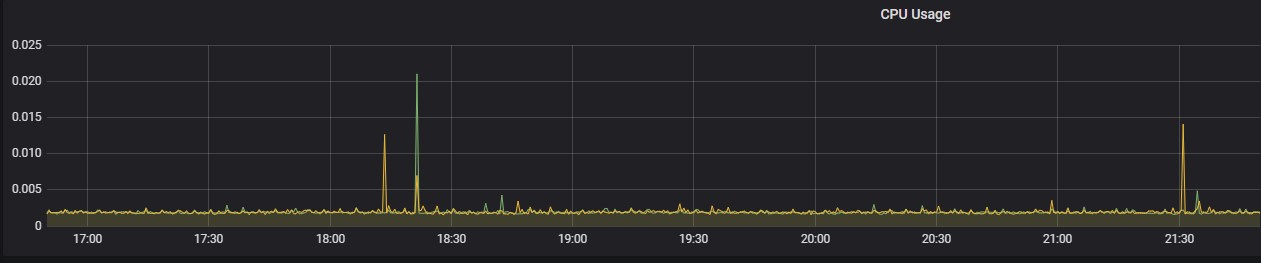
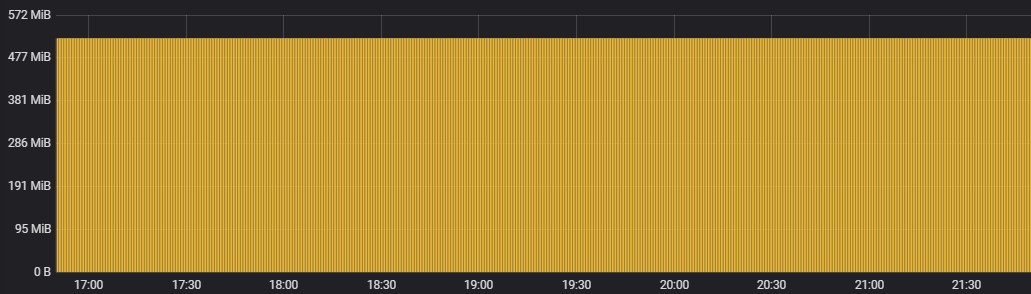
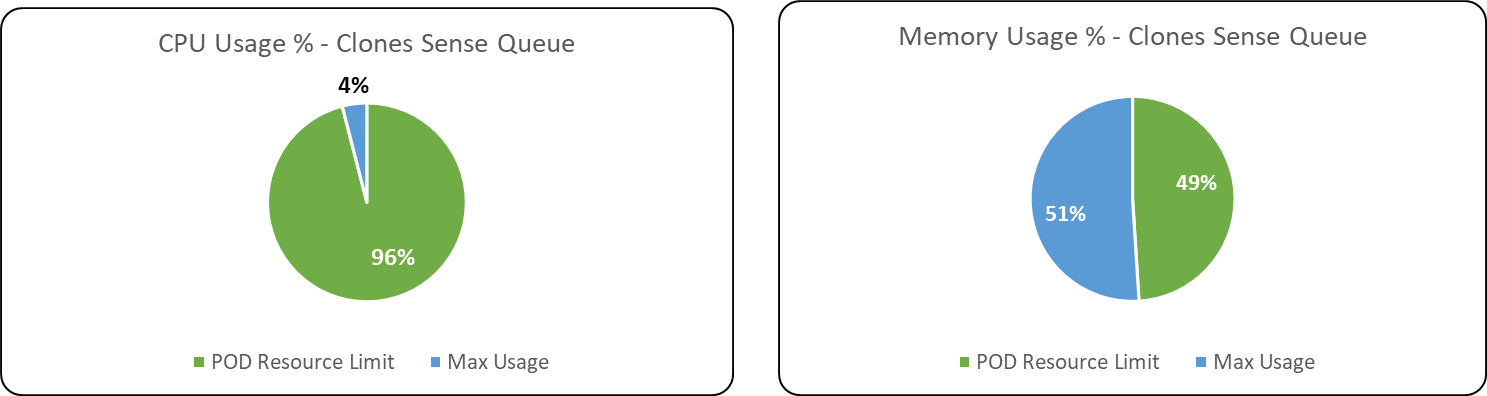
Clones Sense Queue
CPU Usage
Memory Usage
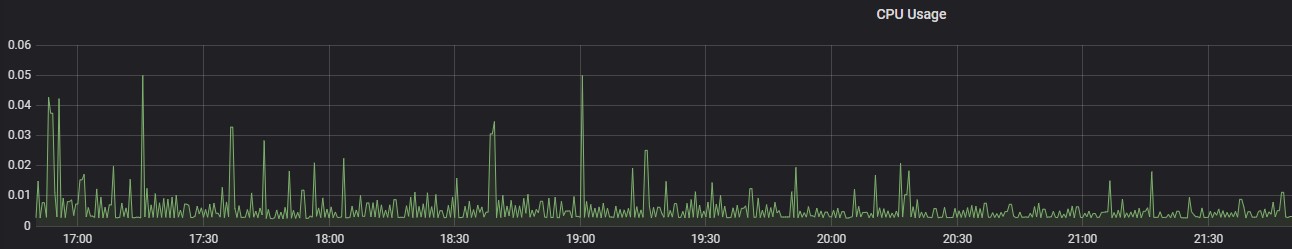
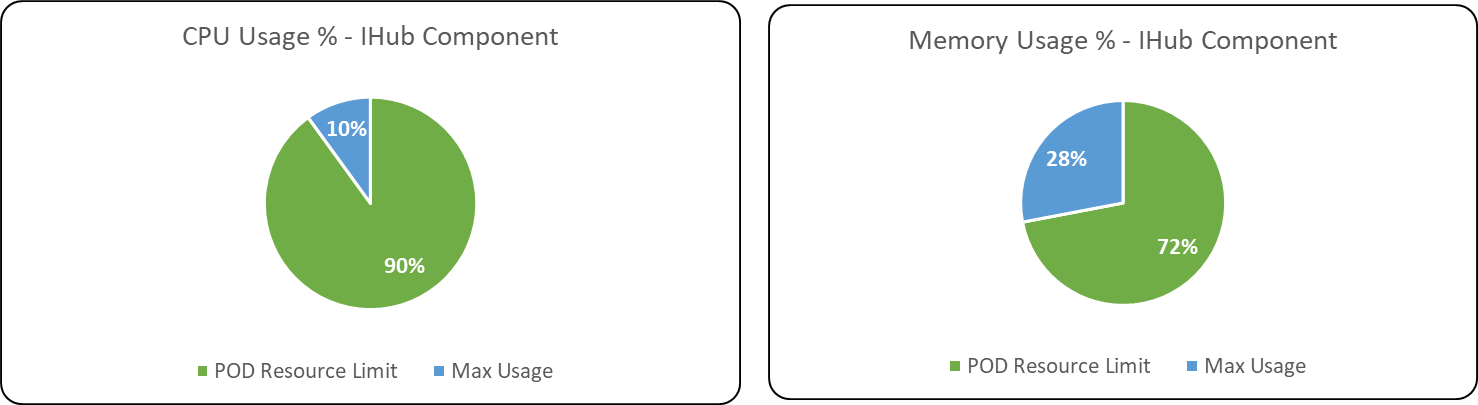
iHub Component
CPU Usage
Memory Usage
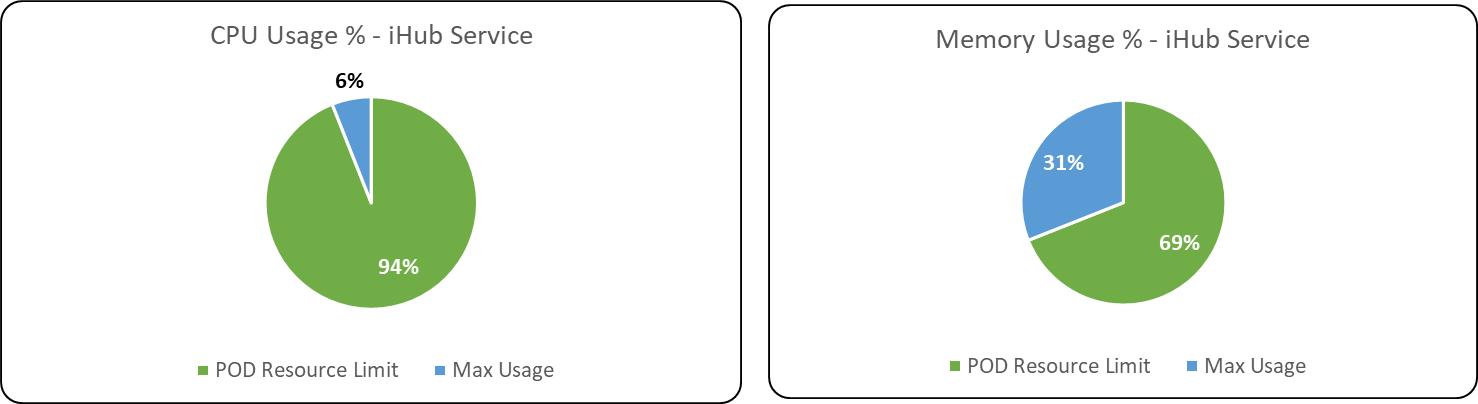
iHub Services
CPU Usage
Memory Usage
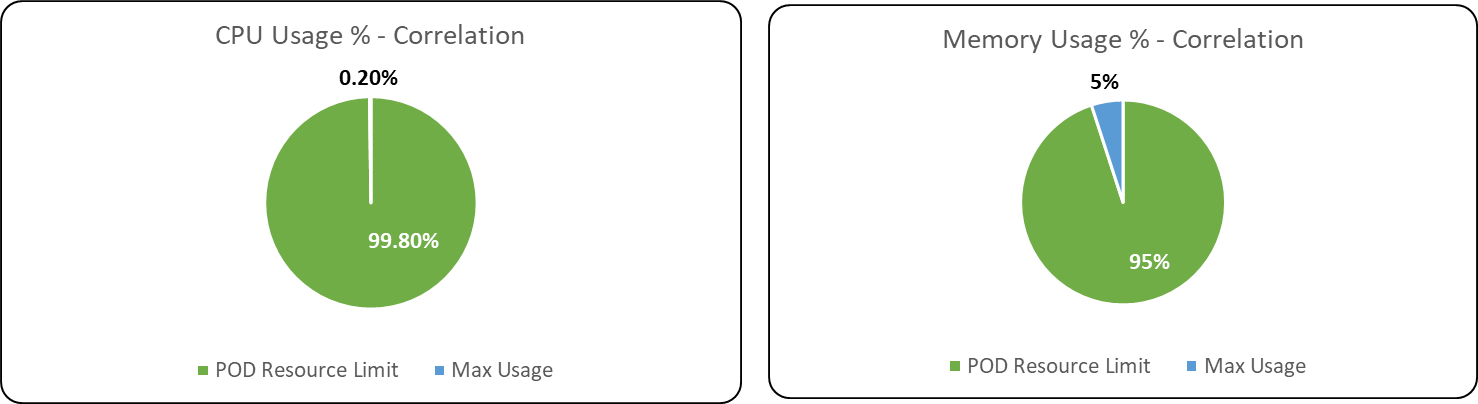
Alert Correlation
CPU Usage
Memory Usage
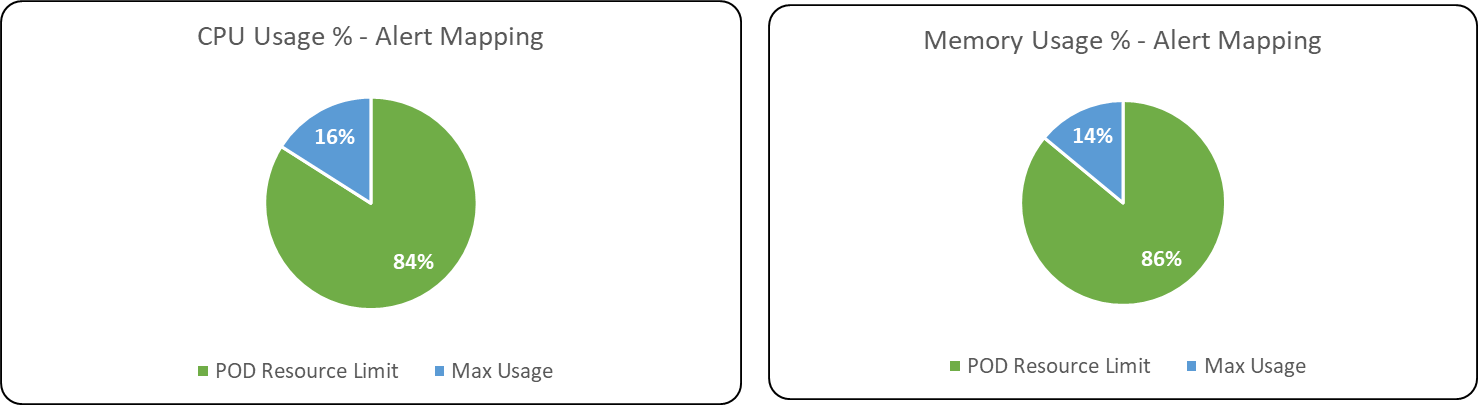
Alert Mapping
CPU Usage
Memory Usage
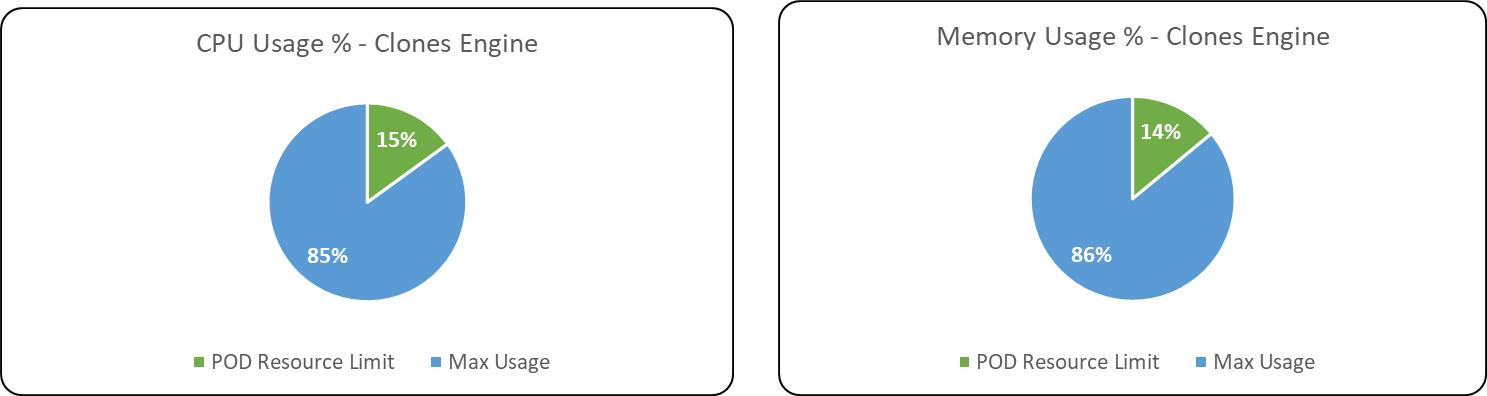
Following are the percentage wise use of CPU & Memory of each application components,
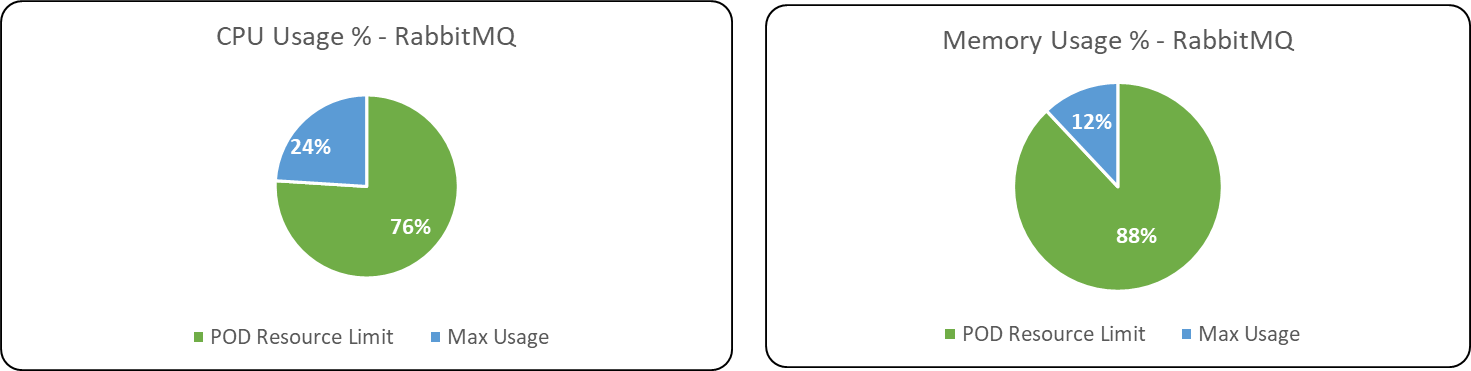
Max usage represents the maximum value reached in resource usage (CPU, Memory) during the test run. POD resource limit represents the max limit set in each component Kubernetes POD.
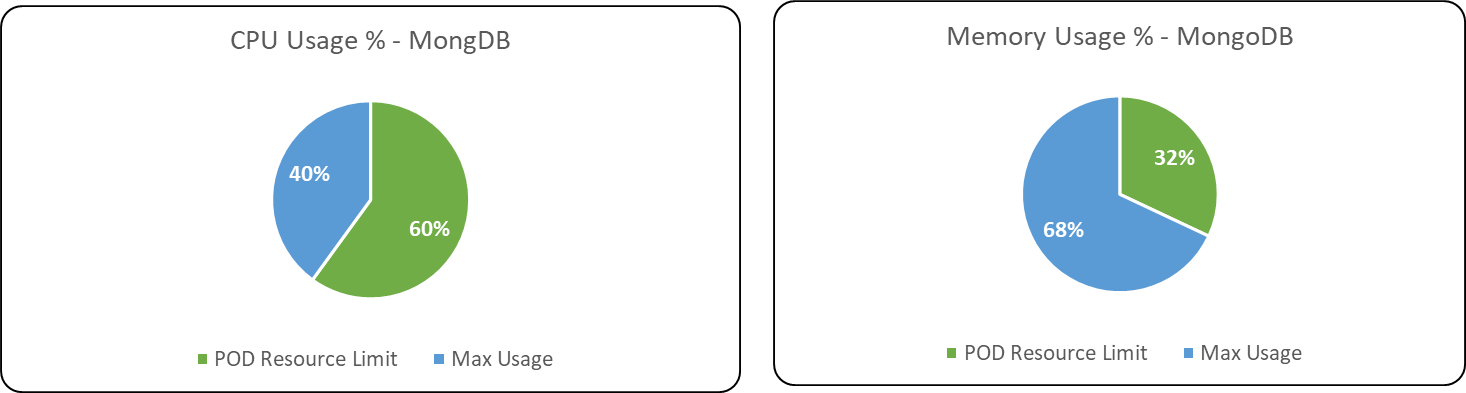
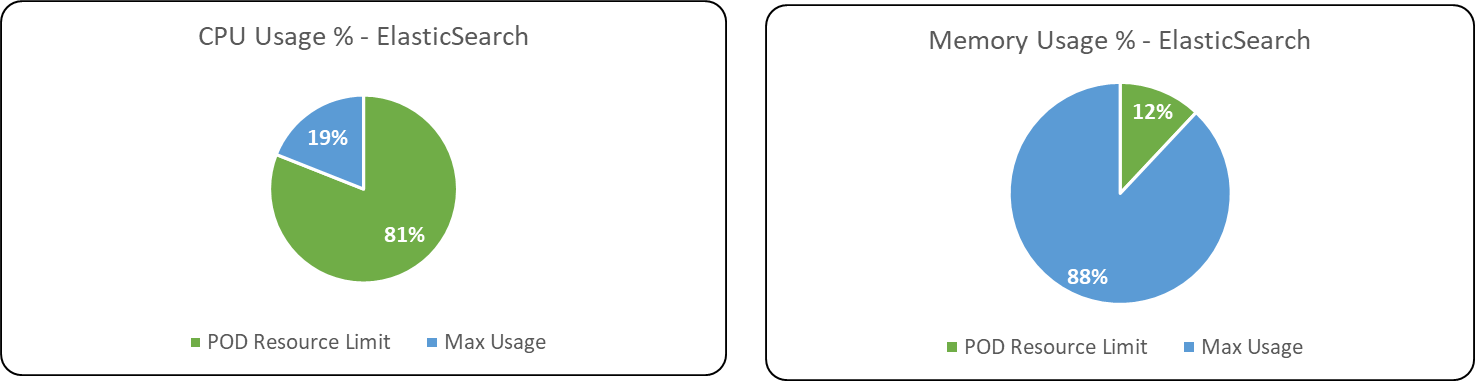
Databases & Message Broker
Below table summarizes the CPU & Memory max usage of the database & message broker components used by ITOps.
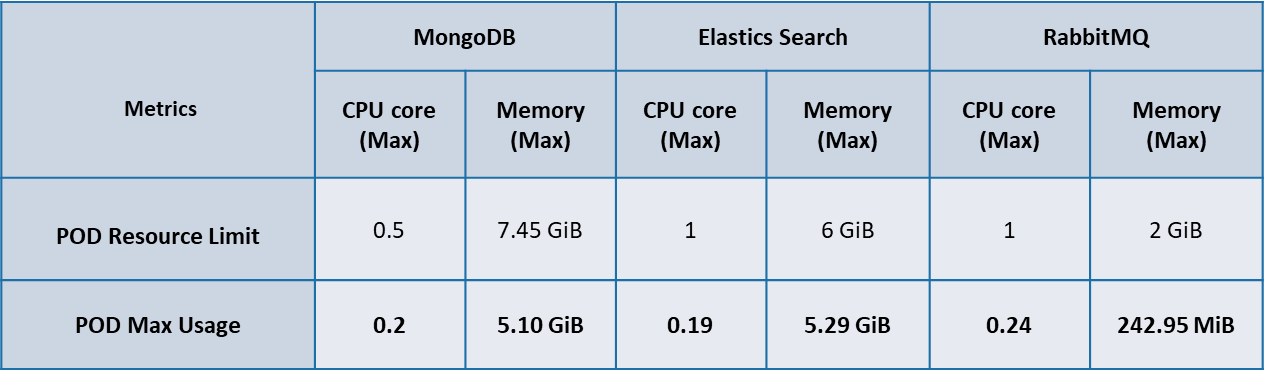
Following are the percentage wise use of CPU & Memory of each Database & Message Broker components of ITOps.
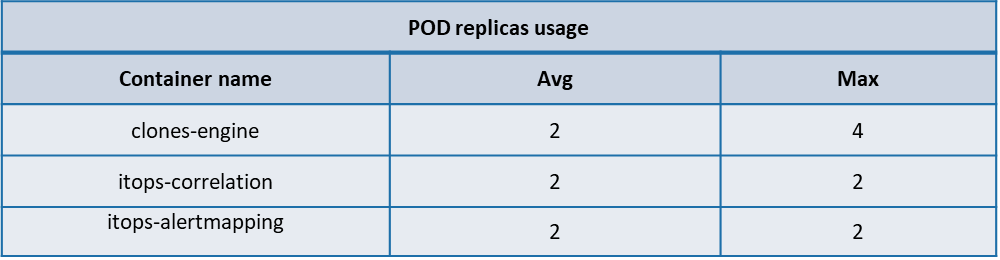
POD Autoscaling metrics
Following are the usage of replicas of POD’s of the ITOps components identified for Auto scaling. During test executions its observed that apart from clones engine none of the components which had autoscaling enabled had any change on the pod replica count from its minimum value.
The below table summarizes the average, Max POD replica usage of the following ITOps components identified for autoscaling.
Performance test Observations & Recommendations
-
Multiple tests have been conducted with over 13000 alerts to verify the Alert Surge processing functionality with test execution spanned over a longer duration.
-
During initial test executions variations were observed in the ITOps received alert count being logged into the Alert Analytics DB which had resulted inconsistency on alert surge start & end detection. Also, tickets were not getting created on the alert surge cluster newly created.
Based on the Bugs raised Platform team had optimized the alert analytics processing solution which had resolved the alert count variation logging and the alert analytics processing had worked consistently without any issues throughout the test execution.
-
During the last test execution it’s also observed that in 2 instances during test execution the Alert Analytics scheduler which was configured to run every 1minute got a delayed execution in a 2 minute interval in one instance which had resulted in an alert count overlapping in one of the records of alert count being logged into the DB. In second instance the Alert Analytics scheduler got executed in a time interval of 1 Millisecond. This was reported to concerned team for further analysis.
-
Its observed that the time taken for alert correlation slightly got increased in ITOps 1.4 in comparison with previous version 1.3, The time taken for the correlation of each alert is 4.11 seconds (P90) whereas in ITOps 1.3 it was 3.38 seconds (P90).
-
After Analysing the resource usage (CPU/Memory) pattern during the multiple long duration test executions conducted in ITOps 1.4 & 1.3, its recommended that POD resource configuration limits of the following ITOps components such as iHub Component, IHub Services, Alert Correlation, Alert mapping can be lowered to the resource configuration limits recommended on ITOps Components Resource configuration optimization test conducted.
This would help in reducing the computing resource usage and there by reduces the Infrastructure cost.
ITOps Components Resource configuration optimization test report is available here.
Performance test metrics comparison- ITOps 1.4 & 1.3
Time taken for Alert correlation
|
ITOps version |
Correlation Workflow Alert Threshold Count |
Correlation Workflow Scheduler Interval (Minutes) |
Time Taken for correlating each alert (seconds) |
|
|
90 Percentile |
Median |
|||
|
1.4 |
55 |
3 |
4.11 |
3.69 |
|
1.3 |
55 |
3 |
3.38 |
1.76 |
There is certain increase observed in time taken for alert correlation in ITOps 1.4, it took 4.11 seconds (P90) for each alert correlation where as in ITOps 1.3 it was 3.38 seconds (P90).
Workflow Execution Time
Following are the comparison of the Execution & Queue time metrics of the different workflows of ITOps executed during test execution conducted in ver. 1.4 & 1.3.
|
ITOps Version |
|
Correlation Workflow |
|
|||
|
E |
xecution Time (Seconds) |
Q |
ueue Time (Seconds) |
|||
|
Avg |
Min |
Max |
Avg |
Min |
Max |
|
|
1.4 |
1.65 |
1.2 |
3.9 |
2.51 |
0.36 |
172.7 |
|
1.3 |
1.51 |
0.97 |
16.60 |
2.53 |
0.35 |
742.62 |
|
ITOps Version |
|
Ticket Update Scheduler |
|
|||
|
E |
xecution Time (Seconds) |
Q |
ueue Time (Seconds) |
|||
|
Avg |
Min |
Max |
Avg |
Min |
Max |
|
|
1.4 |
9.6 |
7.5 |
14.9 |
0.68 |
0.40 |
1.4 |
|
1.3 |
14.60 |
2.82 |
34.33 |
8.0 |
0.34 |
743.14 |
|
ITOps Version |
|
Auto close Flap Cluster |
|
|||
|
E |
xecution Time (Seconds) |
Q |
ueue Time (Seconds) |
|||
|
Avg |
Min |
Max |
Avg |
Min |
Max |
|
|
1.4 |
4.80 |
3.14 |
15.8 |
1.65 |
0.44 |
59.57 |
|
1.3 |
5.42 |
2.53 |
41.87 |
5.88 |
0.36 |
743.18 |
Infrastructure Cost
Following is the approximate pricing for the infrastructure used for the performance test of ITOps 1.4. More details on the Hardware Infrastructure used for Performance test is shown below.
|
Product / Flavour |
Minimum |
Maximum |
|
ITOps |
₹161,588.30 |
₹245,829.38 |
Please note that this is indicative and actual billing could vary based on network usage, operations, data etc.
ITOps Infrastructure configuration
Performance test Execution results
Raw data collected as part of test execution is available on the following SharePoint location Test Data