AIOps 2.2 - Performance Test Report
Contents
- Overview
- Performance Testing – Workload Parameters
- Test Environment - Infrastructure setup
- Performance Testing - Software Used
- Performance Testing – AIOps components & Replicas
- Performance Test Approach
- Performance Test -Summary
- Performance Metrics Captured
- Test 1
- Test 2
- Test 3
- Performance Test – Infrastructure Resource Usage
- Alert Mapping
- Performance test Observations & Recommendations
- Performance test metrics comparison
- Performance test Execution results
Overview
AIOps 2.2 release focuses on new features like
-
AutoResolution in AIOps Desk & Resolve
-
AI Based similarity check in correlation rules
-
Configurable labels for alert/ticket states and action
-
Redefined default alert/ticket states and action
In addition to these capabilities, few enhancements are also brought in like
-
New operators in policies and rules
-
ITSM time format in project config
-
Customize ticket updates when new alert is correlated to ticketed cluster
-
Refer to alert attributes from first alert, ticketing alert, current alert or alert cluster in ticket create and ticket correlate templates.
Performance Testing – Workload Parameters
The following parameter define the workload of performance testing of AIOps using Queue channel.
|
SYSTEM WORKLOAD PARAMTERS |
|
|
Total sample Alerts |
5000, 3139, 4860 |
|
Test Duration |
32 hours and 40 minutes |
|
Monitoring Agent type |
SolarWinds |
|
Type of Alerts |
UP, DOWN, WARNING, CRITICAL |
Test Environment - Infrastructure setup
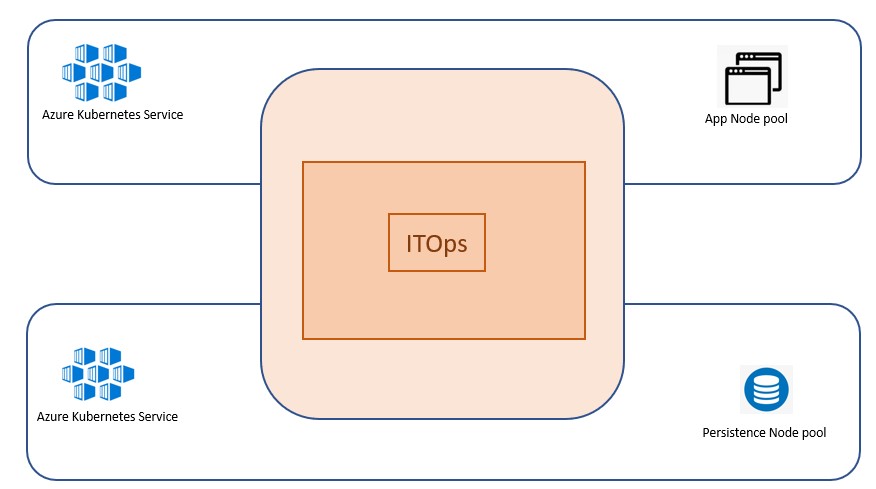
AIOps components, IHub, Clones, Databases & Message Broker are hosted in Kubernetes environment in Azure cloud.
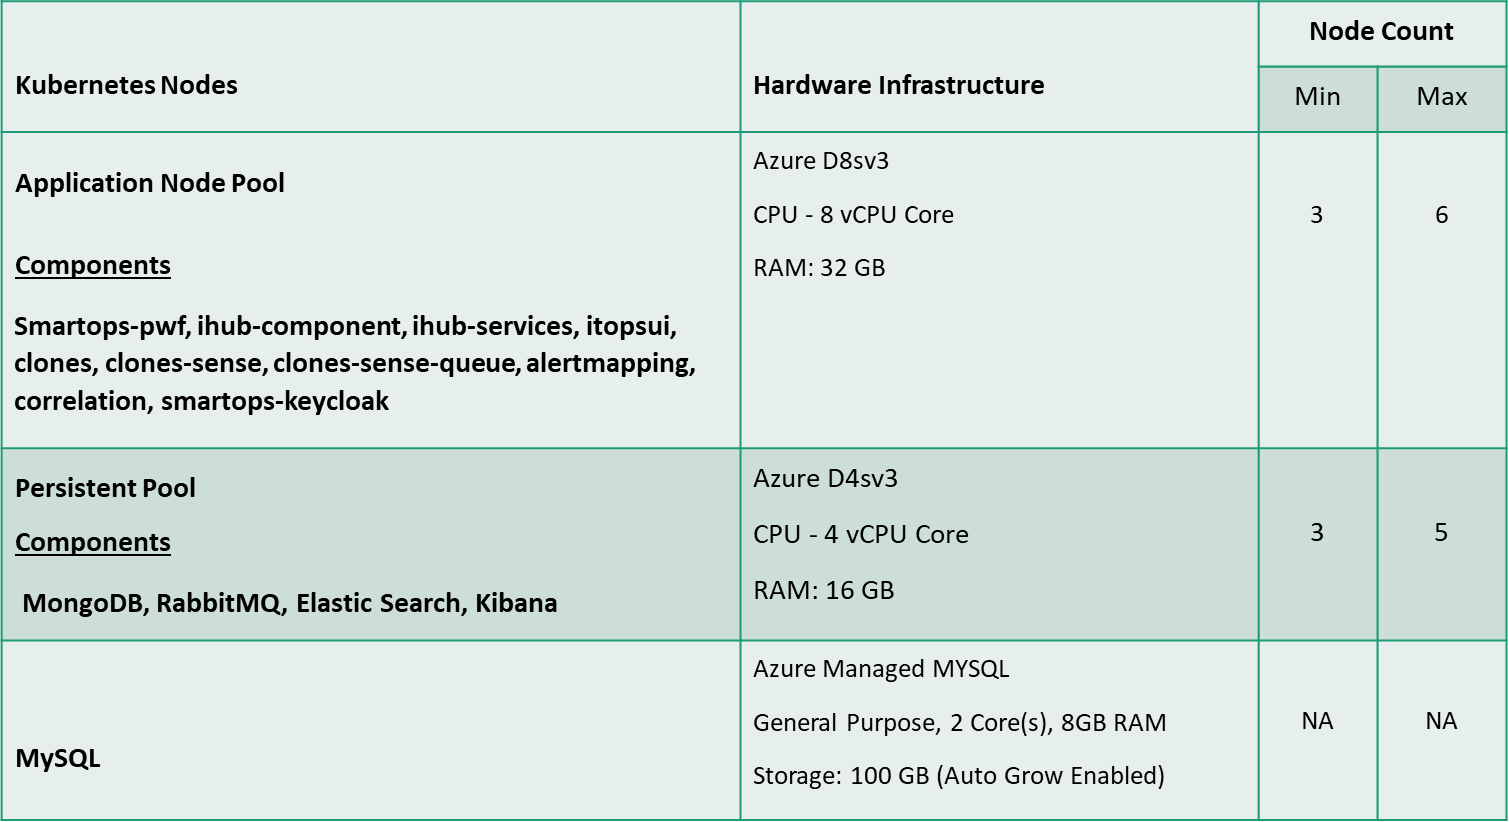
Performance Testing is conducted with the following configuration of Kubernetes Cluster hosted in Azure. The Kubernetes AIOps cluster comprises of 2 different types of node pools such as Application Node Pool, Persistent Node Pool.
MYSQL is hosted as an Azure Managed Service.
The below table summarizes the hardware configuration & Number of VM & components hosted in each Node Pools.
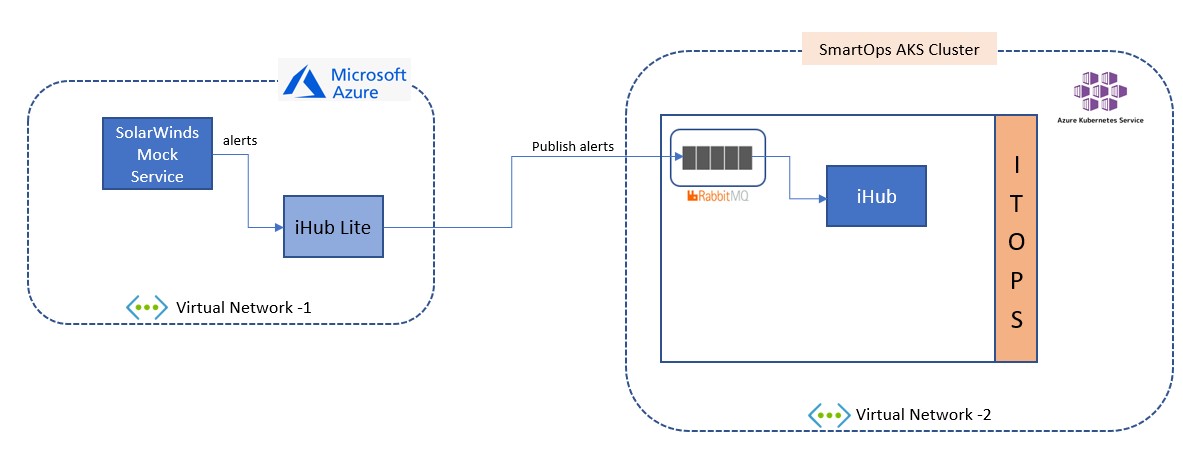
Performance test environment setup
To replicate a production-based Infrastructure environment IHub Lite & SolarWinds based mock service are hosted in an Azure VM hosted at Azure cloud in a different virtual network.
IHub main along with AIOps components are hosted at Kubernetes environment in Azure cloud in another virtual network.
Performance Testing - Software Used
Following Tools used as part of performance testing
|
Tools used |
Version |
Description |
|
Grafana |
|
Dashboard to view resource utilization |
|
Microsoft Excel |
|
Analysing test results and reports |
|
AIOps |
2.2.2 |
|
Performance Testing – AIOps components & Replicas
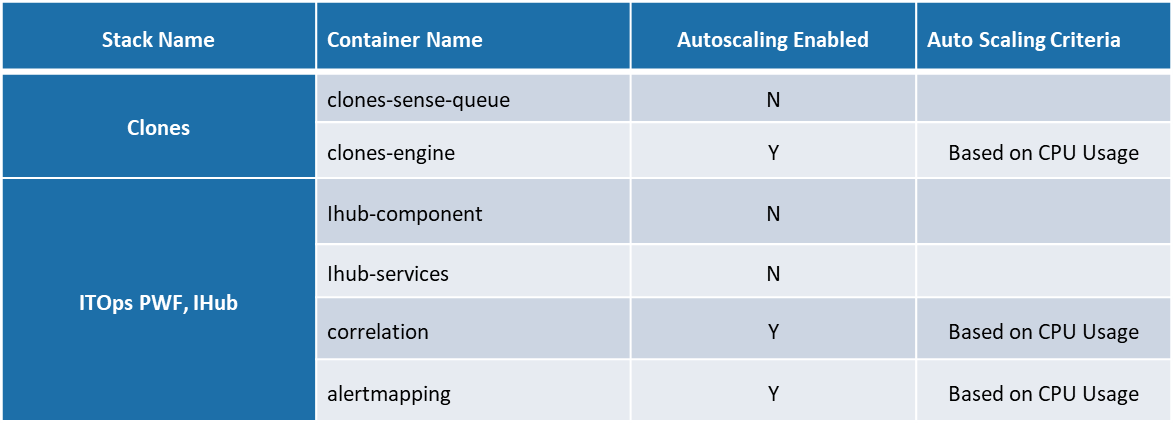
The below table provides details of docker containers of different components associated with AIOps such as Clones, AIOps components, Clones, iHub, Database & Message Broker.
This also provides detail of components identified for Autoscaling and the criteria defined for Autoscaling. As part of ensuring availability of non-scalable components to avoid failures of any components during document processing, 2 instances of each components are by default available in the Kubernetes cluster.
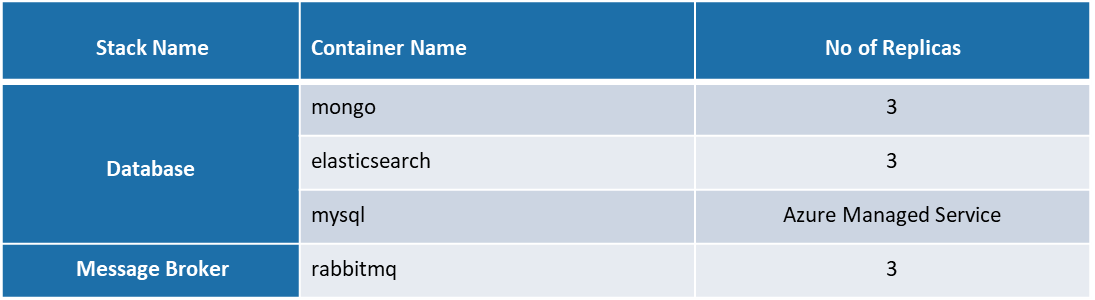
Following are the details of replicas configured for Database & Message Broker in Kubernetes cluster MySQL is deployed as a Managed service at Azure.
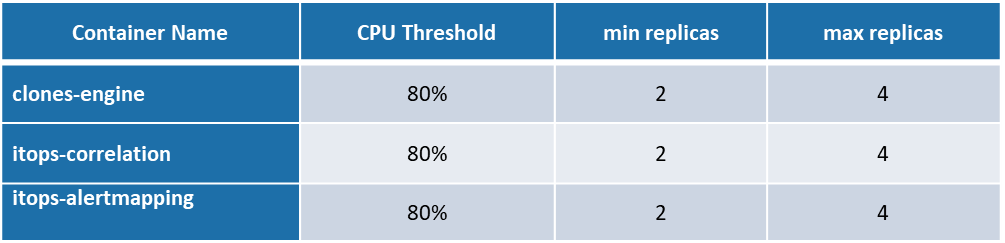
Autoscaling Configurations
Following are the CPU threshold limits, Replicas (Minimum & Maximum) configured for each component identified for Autoscaling in Kubernetes cluster for AIOps.
Performance Test Approach
Performance Testing of AIOps is conducted by sending system alerts & notifications captured by SolarWinds monitoring agent. A SolarWinds monitoring agent based mock service is created to simulate different types of System alerts such as UP, DOWN, Warning & Critical, alerts are simulated by the mock service.
This service is polled continuously by IHub Lite API scanner channel in a fixed interval and the polled data is pushed to AIOps Queue system from which the alerts are processed further by IHub main & AIOps. SolarWinds based mock service simulates alerts archived from a production-based system.
Test is conducted by simulating different counts of system alerts by mock service in a specific interval at different alert times. This helps in creating system alerts workload like a production-based environment.
To capture performance metrics on alert correlation, AIOps project is created using SmartNOC as flavour.
Performance Test -Summary
Performance Testing of AIOps is conducted by sending SolarWinds based alerts samples simulated from a SolarWinds mock service cumulatively for a duration of 32 hrs and 40 minutes.
Test is conducted with SolarWinds mock service simulating 17 alerts every minute. The mock service simulates alerts archived a production system. This also helps us in verifying the functionalities of AIOps processing as the alert data archived replicates all the alert scenarios & patterns occurred in a real production system.
IHub lite API scanner channel polls the mock service continuously in an interval of 1 minute and IHub lite channel publishes the alerts to AIOps Queue from which further processing of alerts starts.
This test report is prepared based on the metrics collected from last 3 test execution conducted using alert data archived from a production system.
Following are the counts of alerts received at IHub Lite, IHub Queue channel & Alert store. There was no missing of alerts observed in the test execution.
|
Test Execution |
Total alerts received at iHub Lite from mock service |
Total alerts received at iHub Queue Channel |
Total alert received in alert store |
|
Test 1 |
5000 |
5000 |
5000 |
|
Test 2 |
3139 |
3139 |
3139 |
|
Test 3(AI) |
4860 |
4860 |
4860 |
In the Test 3, AI based correlation was enabled, whereas in the prior ones it was disabled
Performance Metrics Captured
Alert Correlation Time
To capture the time taken for the correlation of similar and related alerts, the test is conducted by simulating 17 alerts every minute from the mock service. This type of alert simulation pattern ensures that each time the SolarWinds mock service is polled, the count of alerts received will be matching the like a production system workload.
Following are the threshold count of alerts set for correlation workflow and the duration of the schedulers for Correlation, Alert analytics & Auto closure flap cluster configured during the multiple test executions.
Alert Threshold count per execution of workflow represents the count of alerts taken by correlation workflow during each execution of the workflow as part of alert correlation.
|
Alert Threshold Count per execution of correlation workflow |
Workflow Scheduler Interval (Minutes) |
||
|
Correlation |
Alert Analytics |
Auto Close flap cluster |
|
|
20 |
3 |
- |
- |
Following are the time taken for alert correlation during the test executions conducted with above mentioned configuration of alert threshold and workflow scheduler time.
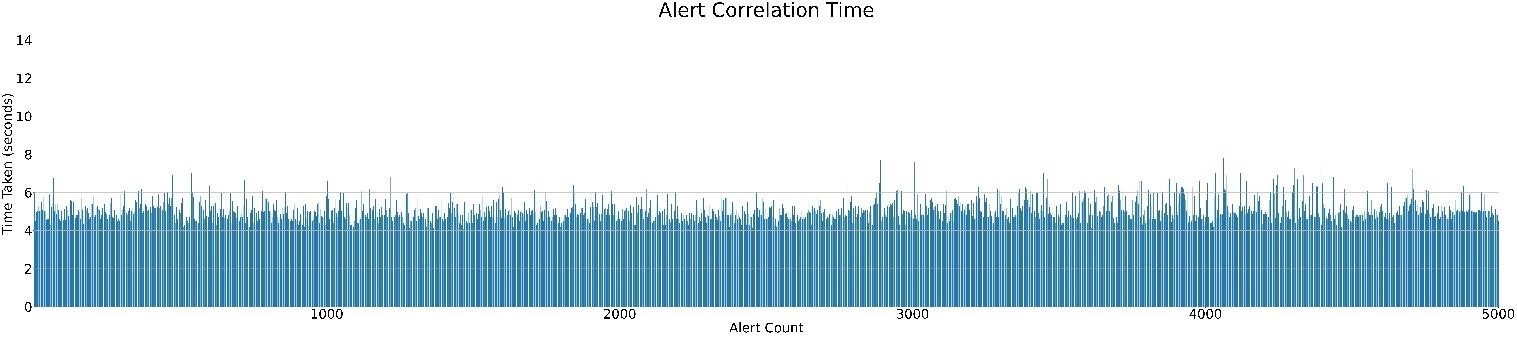
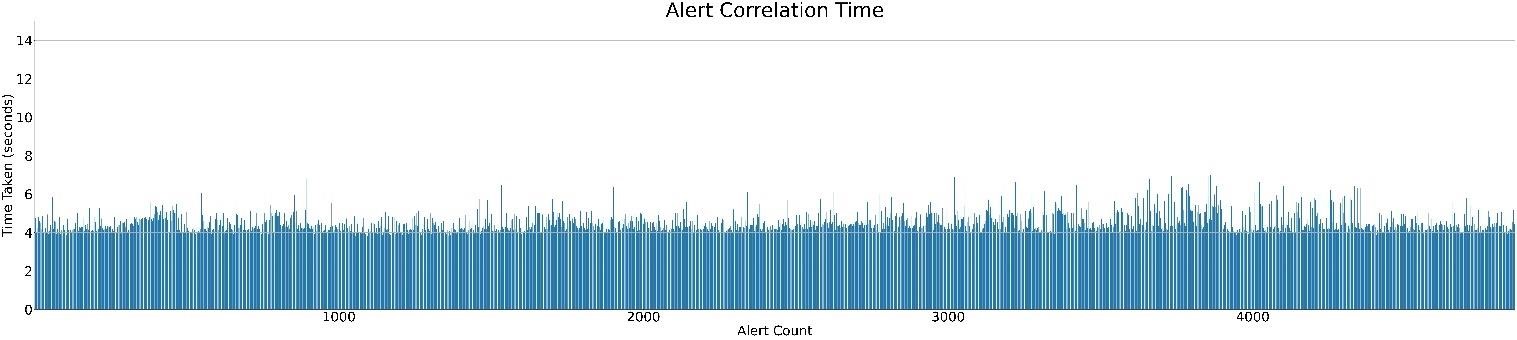
Test 1
Time taken for correlation of each alerts is 5.87 seconds (p90) and median time is 4.99 seconds
|
Correlation time per alert (seconds) |
|
|
90 Percentile |
5.87 |
|
Median |
4.99 |
|
Average |
5.25 |
|
Maximum |
943.7* |
*This was observed in only 1 alert, the second maximum is 11.6. It is expected to be because of blocking of thread, the same has been communicated which would be addressed at a later stage.
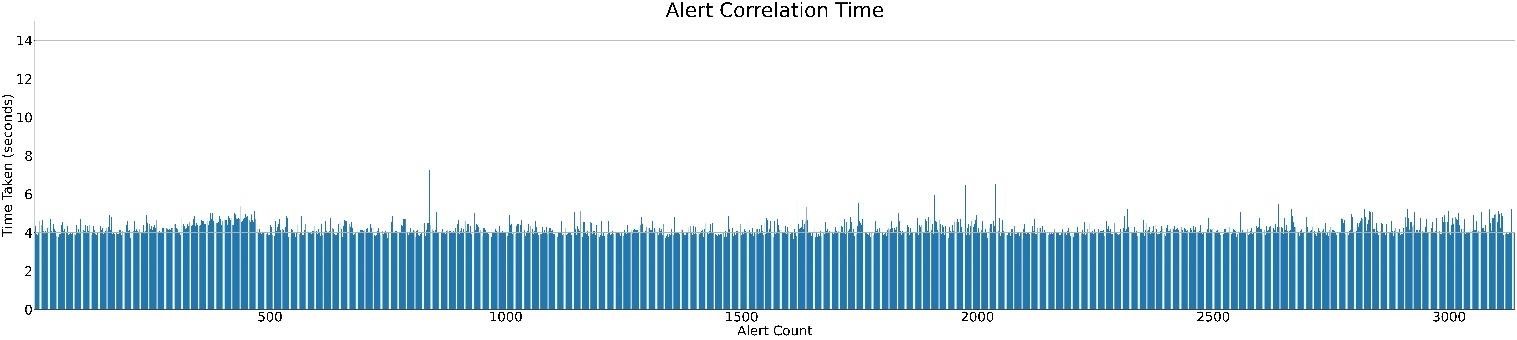
Test 2
Time taken for correlation of each alerts is 4.65 seconds (p90) and median time is 4.08 seconds
|
|
Correlation time per alert (seconds) |
|
|
90 Percentile |
|
4.65 |
|
Median |
|
4.08 |
|
Average |
|
4.19 |
|
Maximum |
|
9.56 |
Test 3
Time taken for correlation of each alerts is 5.15 seconds (p90) and median time is 4.35 seconds
|
|
Correlation time per alert (seconds) |
|
|
90 Percentile |
|
5.15 |
|
Median |
|
4.35 |
|
Average |
|
4.51 |
|
Maximum |
|
7.30 |
Following is the graphical representaion of time taken for correation of each alerts.
Test 1
Test 2
Test 3
Performance Test – Infrastructure Resource Usage
Following are the CPU & Memory usage of various components in AIOps during the test executions.
Application components
Clones Engine
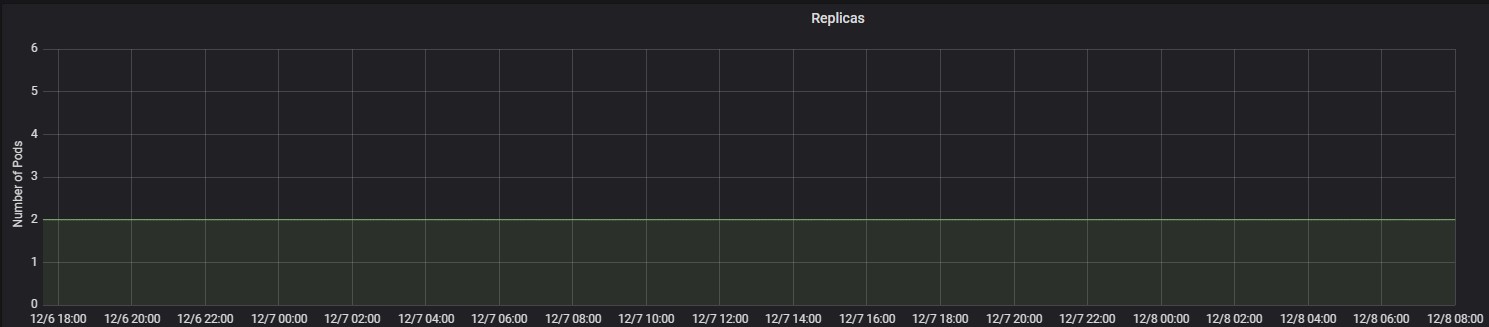
Its observed during test execution that CPU usage in POD’s hadn’t reached above threshold limit at any instance and as a result autoscaling of clones engine didn’t got initiated.
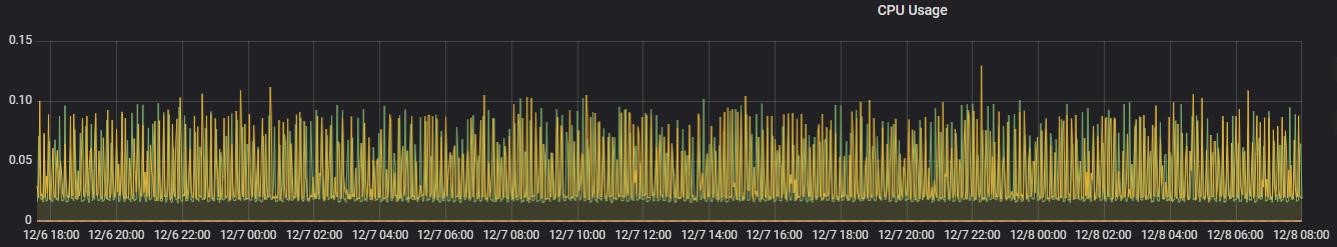
The max CPU usage was only 0.12 core and max memory usage was 4.31 GiB during the entire test set execution.
POD Replica usage pattern of clones engine during test execution is as follows
Followings are the graphical representation of CPU usage of multiple POD’s of clones engine during the test execution.
Other application components
The following tables shows the max CPU & Memory usage of other application components of AIOps.
Even though Auto scaling was enabled in alert correlation & alert mapping component the replica count of both components remained as 2 throughout the test execution.
|
Metrics |
Sense-queue |
IHub component |
IHub Services |
Correlation |
Alert mapping |
|||||
|
CPU Core (Max) |
Memory (Max) |
CPU Core (Max) |
Memory (Max) |
CPU Core (Max) |
Memory (Max) |
CPU Core (Max) |
Memory (Max) |
CPU Core (Max) |
Memory (Max) |
|
|
POD Resource Limit |
0.5 |
1.0 GiB |
0.5 |
2 GiB |
0.5 |
2 GiB |
1 |
1.5 GiB |
1 |
6 GiB |
|
Max Usage |
0.003 |
529.75 MiB |
0.4 |
859.39 MiB |
0.06 |
1.76 GiB |
0.001 |
86.90 MiB |
0.1 |
5.06 GiB |
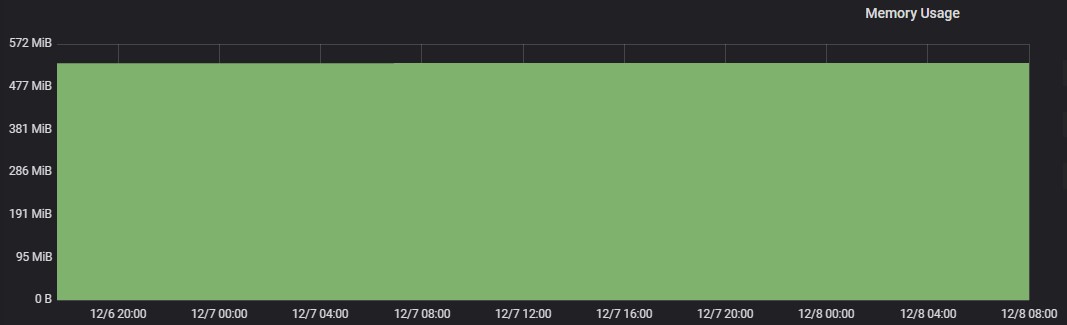
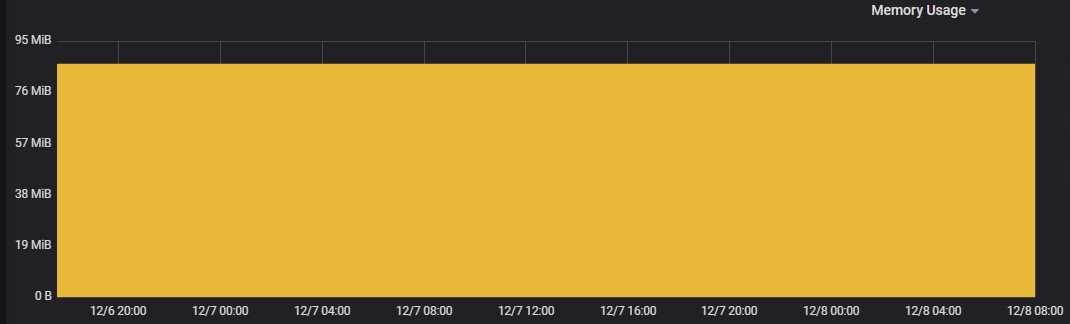
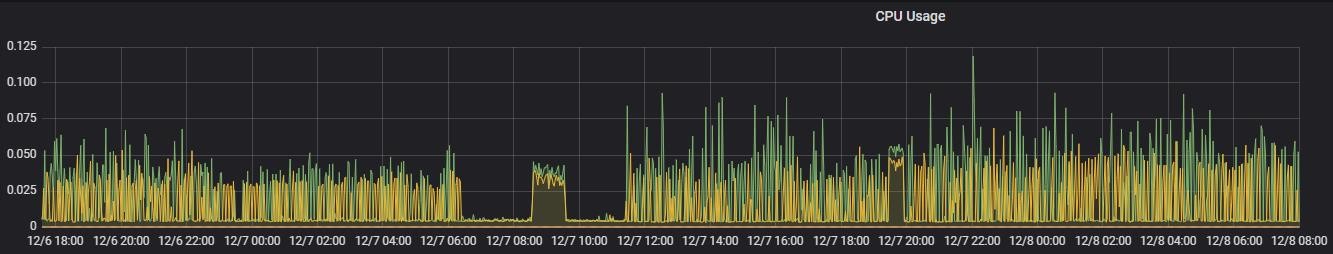
Following are the CPU & Memory usage of other application components in AIOps
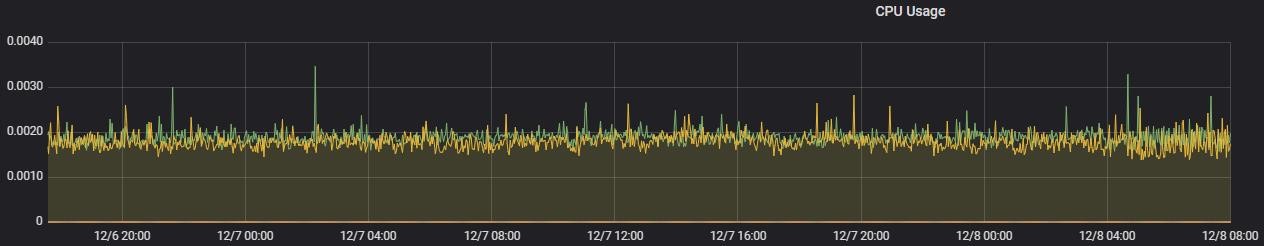
Clones Sense Queue
CPU Usage
Memory Usage
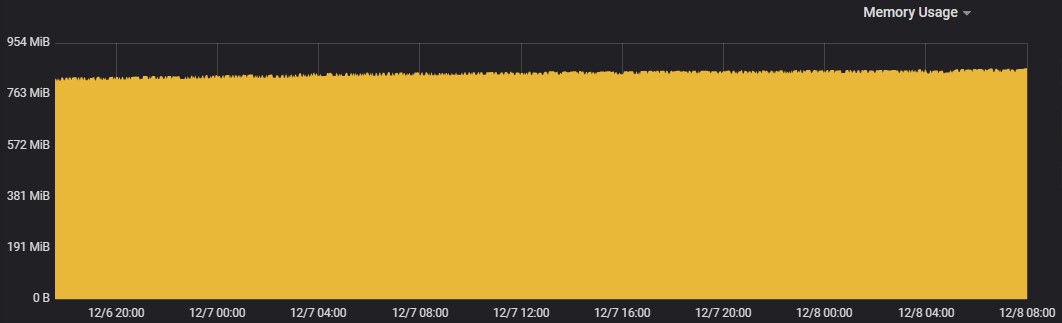
iHub Component
Memory Usage
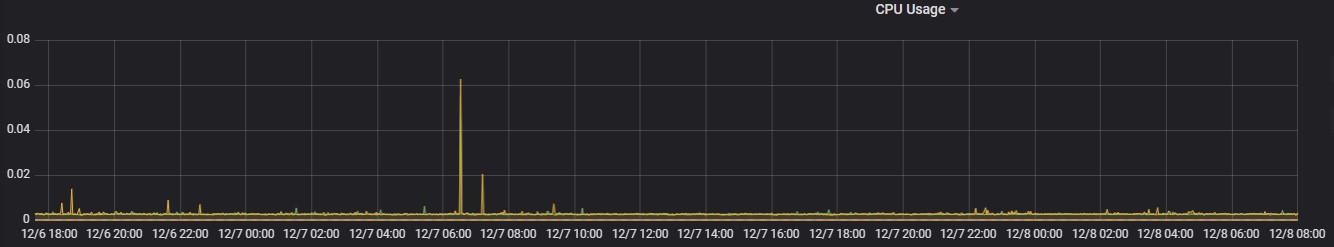
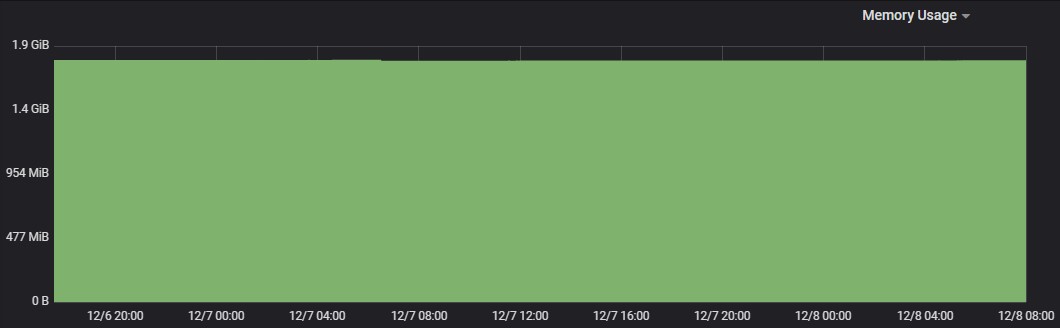
iHub Services
CPU Usage
Memory Usage
Alert Correlation
Memory Usage
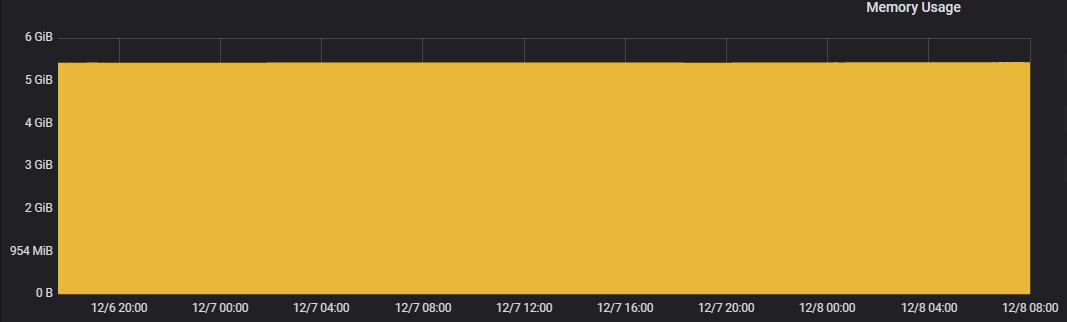
Alert Mapping
CPU Usage
Memory Usage
Following are the percentage wise use of CPU & Memory of each application components,
Max usage represents the maximum value reached in resource usage (CPU, Memory) during the test run. POD resource limit represents the max limit set in each component Kubernetes POD.
Databases & Message Broker
Below table summarizes the CPU & Memory max usage of the database & message broker components used by AIOps.
|
Metrics |
MongoDB |
Elasticsearch |
RabbitMQ |
|||
|
CPU core (Max) |
Memory (Max) |
CPU core (Max) |
Memory (Max) |
CPU core (Max) |
Memory (Max) |
|
|
POD Resource Limit |
0.5 |
7.45 GiB |
1 |
6 GiB |
1 |
2 GiB |
|
POD Max Usage |
0.5 |
5.92 GiB |
0.13 |
5.58 GiB |
0.26 |
304.62 MiB |
Following are the percentage wise use of CPU & Memory of each Database & Message Broker components of AIOps.
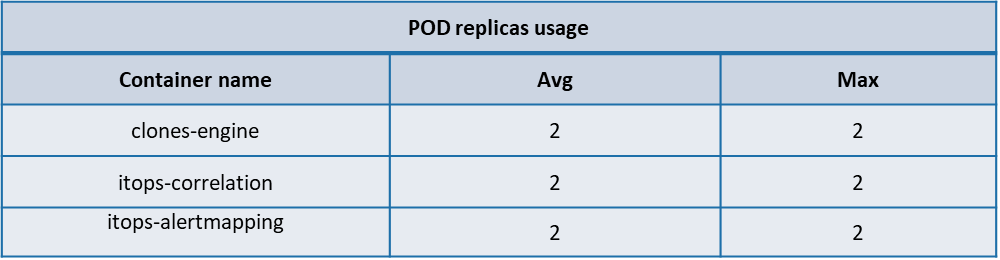
POD Autoscaling metrics
Following are the usage of replicas of POD’s of the AIOps components identified for Auto scaling. During test executions its observed that none of the components which had autoscaling enabled had any change on the pod replica count from its minimum value.
The below table summarizes the average, Max POD replica usage of the following AIOps components identified for autoscaling.
Performance test Observations & Recommendations
-
Multiple test executions conducted using 5000, 3139 and 4860 alerts spanned across a duration of 34 hrs 40 minutes, SolarWinds mock service was configured to simulate 17 system alert samples every minute.
-
Each execution of correlation workflow was configured to accept maximum 20 alerts for alert correlation, with alert correlation threshold count set to 20 time taken for the correlation of each alert sample is 5.87 seconds (P90) & median time taken is 4.99 seconds in 1st test execution. In 2nd test execution the alert correlation time taken for each alert is 4.65 seconds (P90) & median time taken is 4.08 seconds. In 3rd test execution, the alert correlation time taken for each alert is 5.15 seconds (P90) & median time taken is 4.35 seconds.
The time taken for alert correlation in AIOps 2.2.2 is slightly higher in comparison with AIOps ver.2.0.1 if not on par with it, which is due to AI correlation and state transitions being introduced.
-
During initial runs it was observed that elasticsearch pods were encountering very frequent memory and CPU utilization surges, this led to elasticsearch connection timeouts at the application side which was adversely affecting the functionality of the applications resulting in missing of alerts, failure in correlation, blocking execution of correlation workflow, etc. It was found out that a Kubernetes configuration (antiAffinity) was set to value ‘hard’ recently, after which the frequency of incurring the above-mentioned issue increased drastically. As a fix, we had set the value back to ‘soft’ for elasticsearch.
-
Memory usage in all the POD’s of Elasticsearch and alertmapping is high and the usage is constantly above 5 GB throughout the three test executions. The average memory usage is about 5 GB in all the POD’s.
-
Full CPU usage in one of the POD of MongoDB was observed.
Performance test metrics comparison
Time taken for Alert correlation
|
AIOps version |
Correlation Workflow Alert Threshold Count |
Correlation Workflow Scheduler Interval (Minutes) |
Time Taken for correlating each alert (seconds) |
|
|
90 Percentile |
Median |
|||
|
2.2.2 |
20 |
3 |
5.87 |
4.99 |
|
2.0.1 |
55 |
3 |
5.43 |
3.91 |
There is slight increase observed in time taken for alert correlation in AIOps 2.2.2
Performance test Execution results
Raw data collected as part of test execution is available on the following SharePoint location Test Data