Viewing Visualisation Dashboard
To view Monitoring Visualisation project, perform the following steps:
-
Login to SmartOps as Installation Engineer user.
-
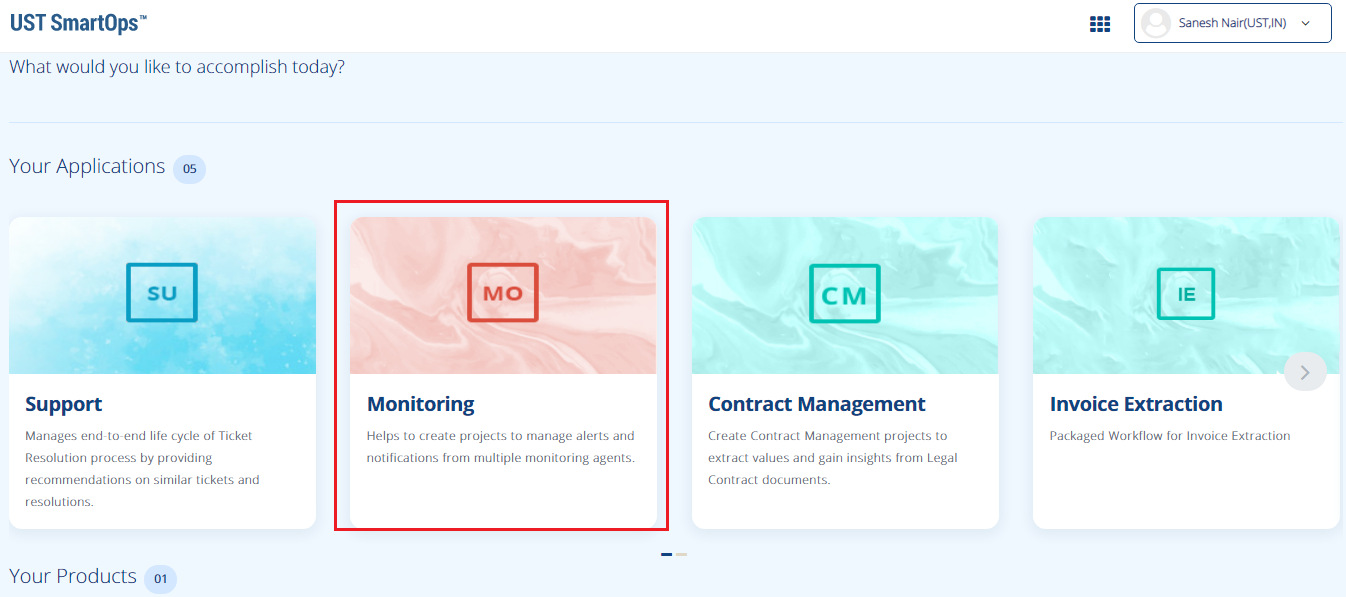
Select Monitoring menu from SmartOps home page as
shown in FigureFigure.
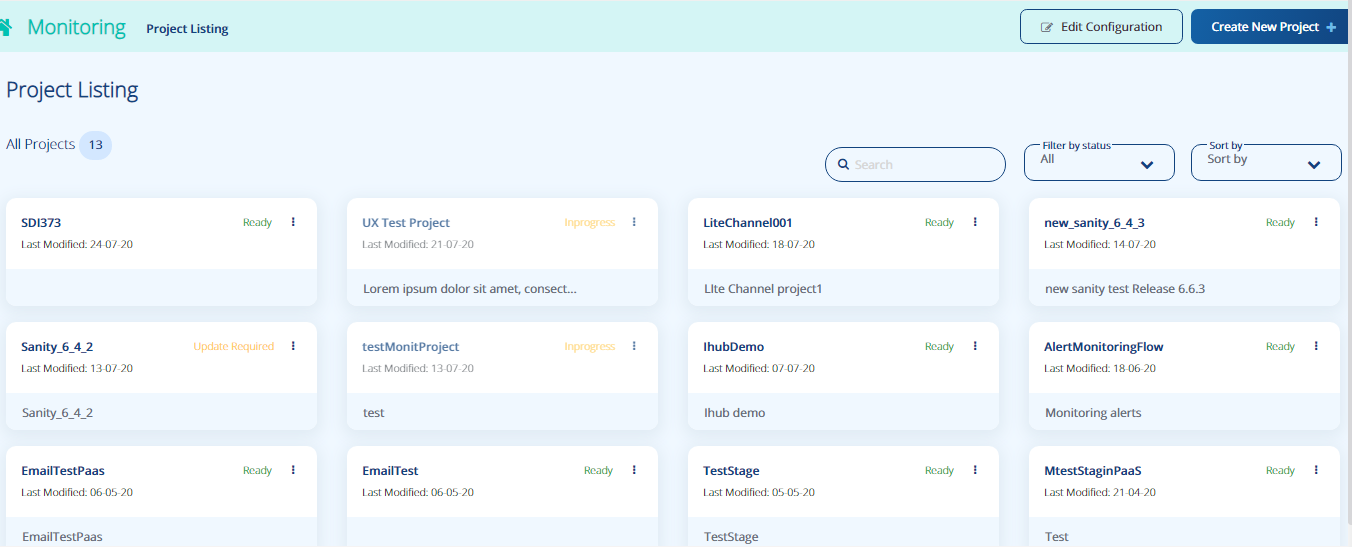
This displays the project listing page as shown below.
-
You may search for the required project from the Search by project name field.
-
You may filter the required project based on status from the Filter By status field.
-
You may sort the projects based on “modified date” or “project name” from the Sort By field.
-
-
Select the required project. This displays the Monitoring Dashboard as shown in FigureFigure.
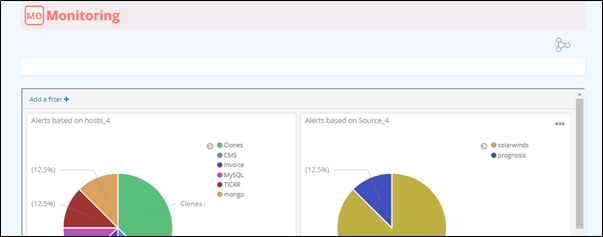
Visualisation Dashboard projects the data as defined using Kibana.